GSoC 2019 project introduction
Summary: Introducing my project for GSoC 2019.
Table of Contents
Introduction
Google Summer of Code (GSoC) is a prestigious global program which aims to bring more student developers into open source software development. This program is for 3 months during the summers.
In order to improve my software development skills and to get myself familiarised with open source software development, I applied for GSoC 2019 with two organisations - Biomedical Informatics, Emory University and Ruby Science Foundation. Thankfully, I was selected for GSoC 2019 with Ruby Science Foundation to work on the plotting library Rubyplot. This is the first of many blogs which I will be writing for my project. This first blog is an introduction to Rubyplot, my project and what to expect at the end of GSoC 2019. Stay tuned for more blogs :)
P.S. - My proposals can be found here :
- Biomedical Informatics, Emory University [Link]
- Ruby Science Foundation [Link] (Up-to-date proposal [Link])
What is Rubyplot?
RubyPlot is a plotting library in Ruby for scientific development inspired by the library Matplotlib for Python. Users can create various types of plots like scatter plot, bar plot, etc. and can also create subplots which combine various of these plots. The long-term goal of the library is to build an efficient, scalable and user-friendly library with a backend-agnostic frontend to support various backends so that the library can be used on any device.
Currently, Rubyplot supports only GR backend and a limited number of plots.
How does Rubyplot work?
To give an overview of how does Rubyplot work, suppose you have a canvas(figure in Rubyplot) and you want to draw 4 paintings(subplots in Rubyplot which is an axes) on the canvas in a way that canvas area is divided into 4 equal squares and so in your mind you divide the canvas space into four parts(axes coordinates for each axes object are decided in Rubyplot). Now, you start to think about a painting(suppose, the first painting out of 4 paintings) and it’s type like for example a still-life figure or a scenery, etc. (different plots in Rubyplot like scatter plot, bar plot, etc.) and so you fix the type of painting in your mind(specifying the type of plot in the axes object). After fixing the type you think about what all things will be in that painting(properties of a plot, for example, data-points, marker size and marker colour in a scatter plot). After fixing one painting you move on to think about the rest and you fix the contents of all those paintings too.
Till now you have fixed what all will be in the paintings and have not actually drawn anything(write (save) in Rubyplot).
Now, you draw the painting(call write in Rubyplot)(in Rubyplot when write is called everything is drawn on the corresponding area including shapes, text, X and Y axis,etc.).
An Example Code
An example code to create a scatter plot would be:
require 'Rubyplot'
@xdata = [1, 2, 3, 4, 5] # Defining X data
@ydata = [11, 2, 33, 4, 65] # Defining Y data
@figure = Rubyplot::Figure.new # Creating the canvas
axes = @figure.add_subplot! 0,0 # Adding a subplot (0,0 as only one subplot is to be plotted)
axes.scatter! do |p| # Setting scatter as the type of subplot
  p.data @x1, @y1 # setting data to be plotted
  p.label = "data1" # defining label for the data
  p.marker_border_color = :blue # defining border colour of the markers
  p.marker_fill_color = :blue # defining fill colour of the markers
  p.marker_type = :circle # defining marker type
end
axes.title = "Nice plot" # defining title of the plot
axes.x_title = "X data" # defining title of X axis
axes.y_title = "Y data" # defining title of Y axis
@figure.write("scatterplot.png") # Drawing the figure and saving it
The output of this is for GR backend is:
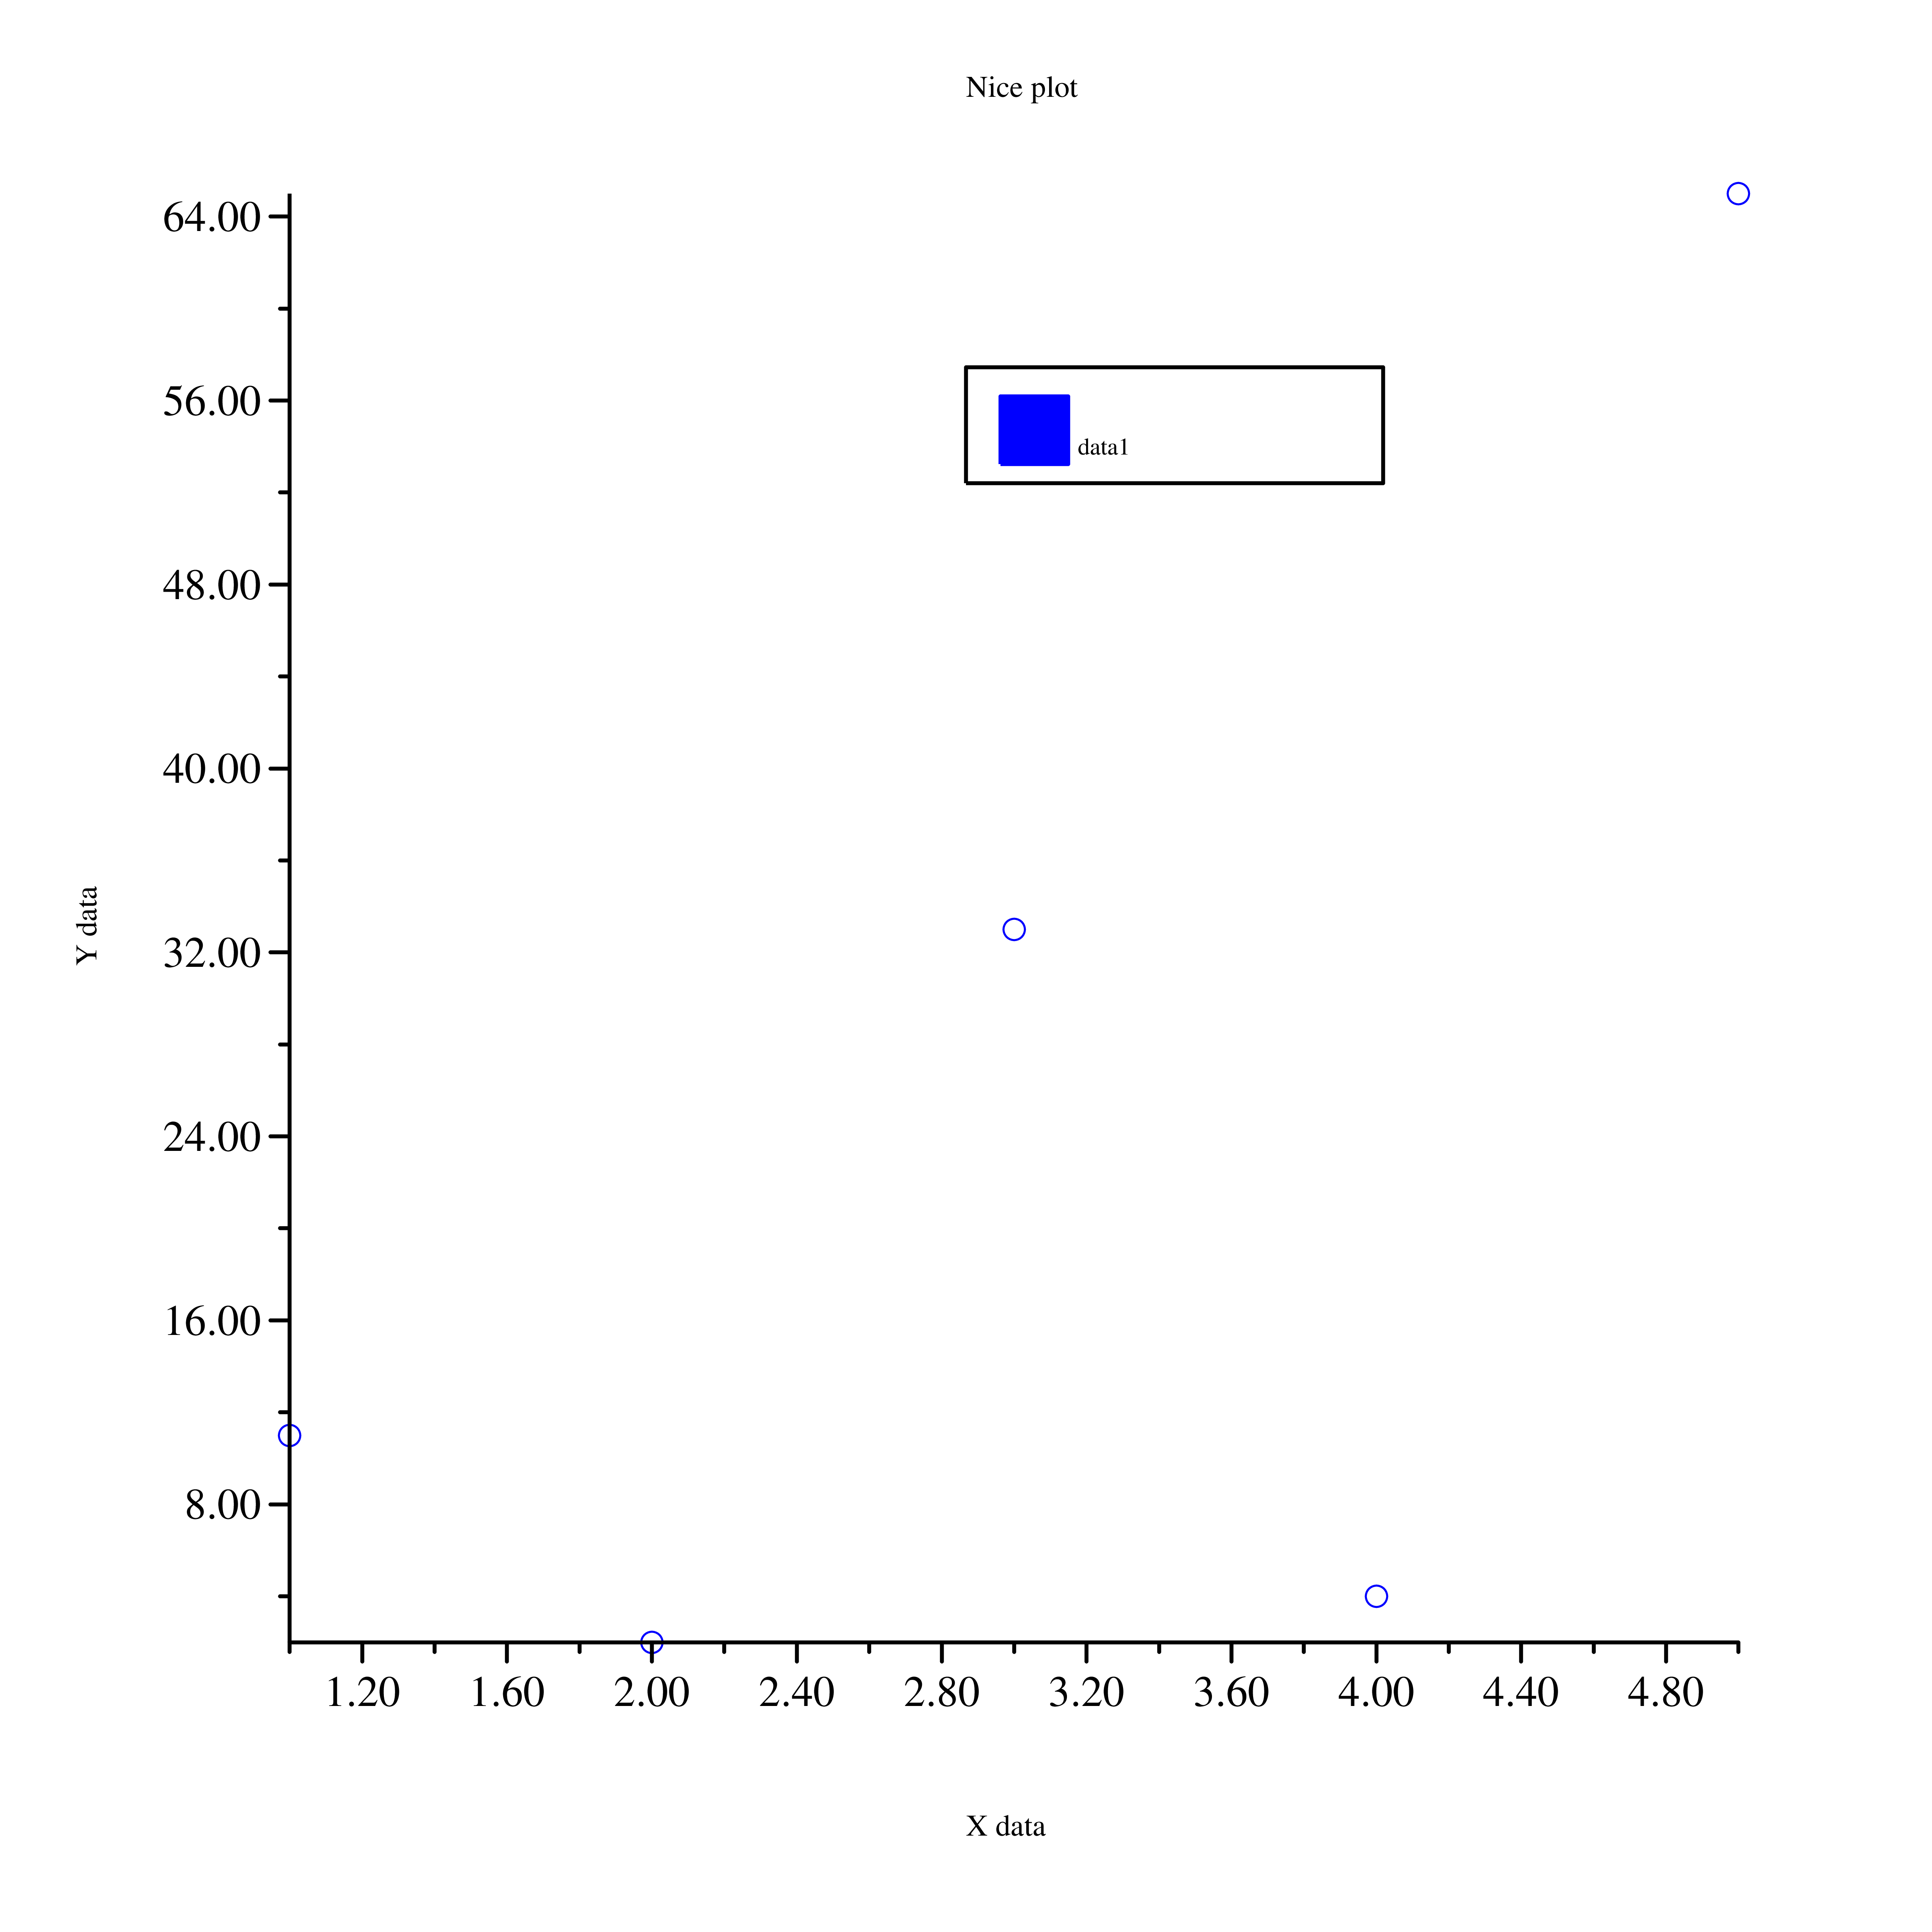
The output of this is for Magick backend is:
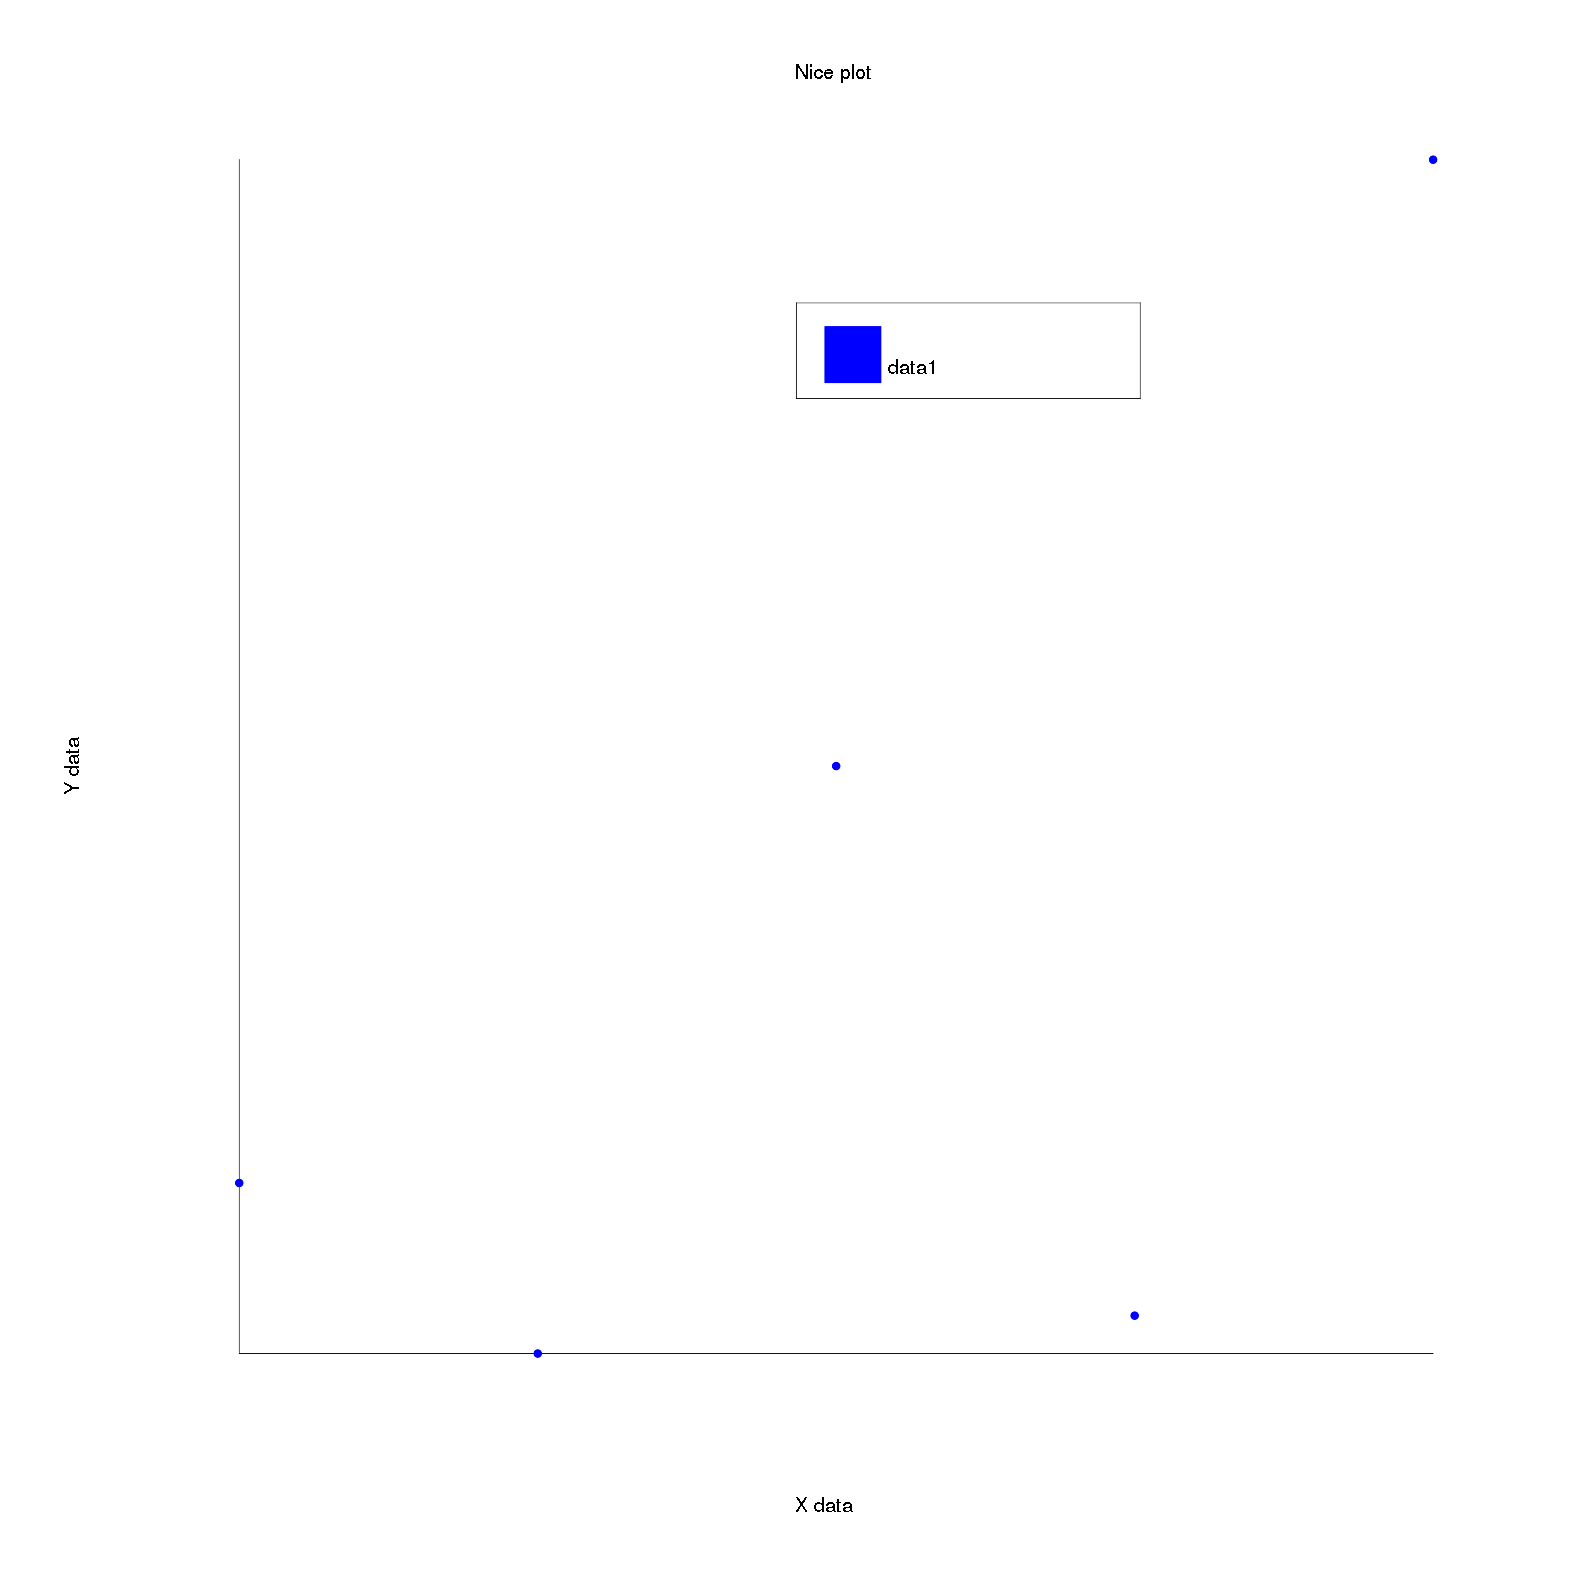
P.S. - The version of the library used to run this code is of the date 9 June and Magick backend was not supported at the time of the start of my project.
So currently, Rubyplot supports GR fully and Magick backend partially(notice the ticks on axes are not implemented).
My Project
My project is to add Magick backend and additional functionalities to Rubyplot. The outcomes of my project would be :
- ImageMagick support: Support for ImageMagick back-end will be added in addition to the currently supported back-end GR, the front-end of the library will be back-end agnostic and the current overall integrity of the library will be preserved.
- Plotting and show function: A new plot function will be added which plots markers (for example circles) to form a scatter plot with the points as inputs (same as plot function in Matplotlib). A new function show will be added which will allow viewing of a plot without saving it. This plot function will be back-end agnostic and hence will support both GR and Magick back-end.
- Integration with iruby notebooks: Rubyplot will be integrated with iruby notebooks supporting all backends and allowing inline plotting.
Ending Note
More details about my project and implementation details can be found in my up-to-date proposal [Link]
Stay tuned for more blogs with more technical depth and challenges which I faced during the project :)
Enjoy Reading This Article?
Here are some more articles you might like to read next: