The show and the plot functions
Summary: Multi plots in Rubyplot.
Table of Contents
Introduction
This blog explains the working of the show and the plot functions and highlights the work done in Week 7 and 8 for GSoC 2019.
show
The show function is an alternative to the write function which is called on the Rubyplot::Figure object i.e. the Figure or the Canvas, it draws the figure which is stored temporarily and is shown in a pop-up window. This is used for a quick view of the Figure and helps in debugging.
Usage of this function is same as write function, suppose figure = Rubyplot::Figure.new then write function is called as figure.write(filename.png'), similarly the show function is called as figure.show. It takes no input.
The write and the show functions are:
def write(file_name, device: :file)
  Rubyplot.backend.canvas_height = @height
  Rubyplot.backend.canvas_width = @width
  Rubyplot.backend.figure = self
  Rubyplot.backend.init_output_device(file_name, device: :file)
  @subplots.each { |i| i.each(&:process_data) }
  @subplots.each { |i| i.each(&:draw) }
  Rubyplot.backend.write
  Rubyplot.backend.stop_output_device
end

def show
  Rubyplot.backend.canvas_height = @height
  Rubyplot.backend.canvas_width = @width
  Rubyplot.backend.figure = self
  Rubyplot.backend.init_output_device(nil, device: :window)
  @subplots.each { |i| i.each(&:process_data) }
  @subplots.each { |i| i.each(&:draw) }
  Rubyplot.backend.show
  Rubyplot.backend.stop_output_device
end
The only difference between both the functions is that the initialization is done differently i.e. init_output_device backend function, for show function there is no file name and hence nil is given and the device is :window, for the write function the device is :file. The main difference is that backend functions called are different.
Device
The device argument and backend variable(output_device) represent the device on which the Figure is to be drawn. The types are:
-
:windowwhich represents a pop-up window on which the Figure will be shown for the show function. -
:filewhich represents a file on which the Figure will be saved for the write function.
Backend functions
The important backend functions which needed to be updated for show function are init_output_device, show and stop_output_device. These functions are explained below:
init_output_device
This function is used to initialize the Figure and it’s properties, for each backend, the functions are:
GR
The function is:
def init_output_device file_name, device: :file
  @file_name = file_name
  @output_device = device
  Rubyplot::GR.clearws

  Rubyplot::GR.beginprint(@file_name) if @output_device == :file
end
The file name and the output device are stored and then the workspace i.e. the Figure or the Canvas is cleared and finally, the printing (i.e. writing) is started if the device is :file i.e. when the write function is called.
Magick
The function is:
def init_output_device file_name = nil, device: :file
  @canvas_width, @canvas_height = scale_figure(@canvas_width, @canvas_height)
  @draw = Magick::Draw.new
  @axes = Magick::Draw.new
  @text = Magick::Draw.new
  if @base_image.nil?
    top_color = Rubyplot::Color::COLOR_INDEX[@figure.theme_options[:background_colors][0]]
    bottom_color = Rubyplot::Color::COLOR_INDEX[@figure.theme_options[:background_colors][1]]
    direction = @figure.theme_options[:background_direction]

    @base_image = render_gradient top_color, bottom_color, @canvas_width, @canvas_height, direction
  else
    @base_image.erase!
  end
  @output_device = device
  @file_name = file_name if @output_device == :file
end
For consistency between the backends, the setup_background_graient function was merged into this function.
So, first, the Figure dimensions are scaled according to the unit of the dimensions. Then the Magick::Draw objects are initialized for drawing. Then, if the base_image is already not initialized, it is created by calling the render_gradient, otherwise, it is just cleared. Finally, the output device is stored. The file name is stored only if the device is :file i.e. when the write function is called.
write and show
Both these functions have the same task to draw everything on the Figure and hence they are similar:
GR
def write
  draw
end

def show
  draw
end

def draw
  draw_axes
end
For GR backend, these functions only draw the X and the Y axes y calling the draw function which calls the draw_axes function. The remaining drawing will be done later.
Magick
def write
  @draw.draw(@base_image)
  @text.draw(@base_image)
  draw_axes
end

def show
  @draw.draw(@base_image)
  @text.draw(@base_image)
  draw_axes
end
For Magick backend, first the plot is drawn, then the text and finally the X and the Y axes.
stop_output_device
This function is used to finish the drawing and clear the memory.
GR
def stop_output_device
  case @output_device
  when :file
    Rubyplot::GR.endprint
  when :window
    Rubyplot::GR.updatews
  end
  flush
end

def flush
  @axes_map = {}
  @file_name = nil
end
For GR backend, depending on the output device different functions are called to finish the drawing. If write function was called i.e. output device is :file then Rubyplot::GR.endprint is called to end the printing i.e. saving of the Figure. Otherwise, if the show function was called i.e. output device is :window the Rubyplot::GR.updatews(which calls the GR inbuilt function updatews()) is called which updates the workspace and opens a pop-up window to show the completed Figure.
Finally, the flush function is called which clears the memory.
Magick
def stop_output_device
  case @output_device
  when :file
    @base_image.write(@file_name)
  when :window
    @base_image.display
  end
  @canvas_width, @canvas_height = unscale_figure(@canvas_width, @canvas_height)
  flush
end

def flush
  @axes_map = {}
  @file_name = nil
end
Similar to the GR backend, depending on the output device, different inbuilt ImageMagick functions are called. If write function was called i.e. the output device is :file then write inbuilt function is called which saves i.e. writes the Figure in a file. Otherwise, if the show function was called i.e. the output device is :window then display function is called which displays the completed Figure on a pop-up window.
Finally, the flush function is called and the memory is cleared.
plot
In the current state, Line and Scatter plots exist as two different kinds of plots. However, the crux of plotting both of these is the same, the only difference being that in one kind of plot we have straight lines connected to co-ordinates while in the other the co-ordinates are simply ‘decorated’. Thus can be many combinations of these plots, which can be combined under a single ‘plot’ interface.
So, to combine these plots, the plot function is created which is considered a BasicPlot in Rubyplot. It is called just like the other plots i.e. scatter plot, line plot, etc. The plot function can draw both scatter plot and line plot even simultaneously.
The inputs taken are the label of the plot(label), the optional type, size, fill colour and border colour of the marker(marker_type, marker_size, marker_fill_color, marker_border_color respectively), the optional type, colour, width, opacity of the line(line_type, line_color, line_width, line_opacity respectively), and the fmt argument which specifies the colour, line type and marker type in short.
fmt argument
Inspired by matplotlib, the fmt argument is a string of characters representing the colours in the plot, the type of the marker and the line.
The characters for colour are:
| characters | colour |
|---|---|
| b | blue |
| g | green |
| r | red |
| c | cyan |
| m | magenta |
| y | yellow |
| k | black |
| w | white |
The characters for marker types are:
| characters | marker type |
|---|---|
| . | dot |
| , | omark |
| o | circle |
| v | traingle_down |
| ^ | traingle_up |
| < | solid_tri_left |
| > | solid_tri_right |
| 1 | solid_triangle_down |
| 2 | solid_triangle_up |
| 3 | solid_tri_left |
| 4 | solid_tri_right |
| s | square |
| p | pentagon |
| * | star |
| h | hexagon |
| H | heptagon |
| + | plus |
| x | diagonal_cross |
| D | solid_diamond |
| d | diamond |
| | | vline |
| _ | hline |
The characters for line types are:
| characters | line type |
|---|---|
| –(two consecutive -) | dashed |
| -. | dashed_dotted |
| - | solid |
| : | dotted |
The fmt argument detects the characters and sets the corresponding variables, possibly overwriting them. The characters can be in any order. The colour of the fmt sets every colour to the given input i.e. the marker fill colour, marker border colour and the line colour.
To set the variables, a hash having characters as keys and symbol as the value is iterated over the keys checking that the character is present in the string or not. The code for taking the fmt argument as input is:
COLOR_TYPES_FMT = {
  'b' => :blue,
  'g' => :green,
  'r' => :red,
  'c' => :cyan,
  'm' => :magenta,
  'y' => :yellow,
  'k' => :black,
  'w' => :white
}.freeze

MARKER_TYPES_FMT = {
  '.' => :dot,
  ',' => :omark,
  'o' => :circle,
  'v' => :traingle_down,
  '^' => :traingle_up,
  '<' => :solid_tri_left,
  '>' => :solid_tri_right,
  '1' => :solid_triangle_down,
  '2' => :solid_triangle_up,
  '3' => :solid_tri_left,
  '4' => :solid_tri_right,
  's' => :square,
  'p' => :pentagon,
  '*' => :star,
  'h' => :hexagon,
  'H' => :heptagon,
  '+' => :plus,
  'x' => :diagonal_cross,
  'D' => :solid_diamond,
  'd' => :diamond,
  '|' => :vline,
  '_' => :hline
}.freeze

LINE_TYPES_FMT ={
  '--' => :dashed,
  '-.' => :dashed_dotted,
  '-' => :solid,
  ':' => :dotted
}.freeze

def fmt=(fmt)
  unless fmt.is_a? String
    raise TypeError, 'fmt argument takes a String input'
  end

  COLOR_TYPES_FMT.each do |symbol, color|
    if fmt.include? symbol
      @marker_fill_color = color
      @marker_border_color = color
      @line_color = color
      break
    end
  end

  LINE_TYPES_FMT.each do |symbol, line_type|
    if fmt.include? symbol
      @line_type = line_type
      break
    end
  end

  MARKER_TYPES_FMT.each do |symbol, marker_type|
    if fmt.include? symbol
      @marker_type = marker_type
      break
    end
  end
end
First, the type of the fmt argument is checked, then the hashes are iterated over for colour, marker type and line type. As soon as a character is matched, the iteration stops. The symbols in line type hash are stored in priority of detection i.e. -- and -. are checked before - so that -. and -- are not mistaken for -.
After setting all the properties of the plot, the draw function is called.
draw
The draw function is:
def draw
  # Default marker fill color
  @marker_fill_color = :default if @marker_fill_color.nil?
  # defualt type of plot is solid line
  @line_type = :solid if @line_type.nil? && @marker_type.nil?
  Rubyplot::Artist::Line2D.new(
    self,
    x: @data[:x_values],
    y: @data[:y_values],
    type: @line_type,
    # type: line_style[1].to_sym,
    color: @line_color,
    opacity: @line_opacity,
    width: @line_width
  ).draw if @line_type
  Rubyplot.backend.draw_markers(
    x: @data[:x_values],
    y: @data[:y_values],
    type: @marker_type,
    fill_color: @marker_fill_color,
    border_color: @marker_border_color,
    size: [@marker_size] * @data[:x_values].size
  ) if @marker_type
end
First the marker fill colour is set to default if it is not specified by the user, then if none of the marker type or line type is specified then the line type is set to solid and marker type is nil i.e. the default plot type is solid line.
Finally, if the line type is given then a Line2D object is created and drawn and if the marker type is given then the draw_markers backend function is called to draw the markers.
Some examples of the plot function are given below.
Examples
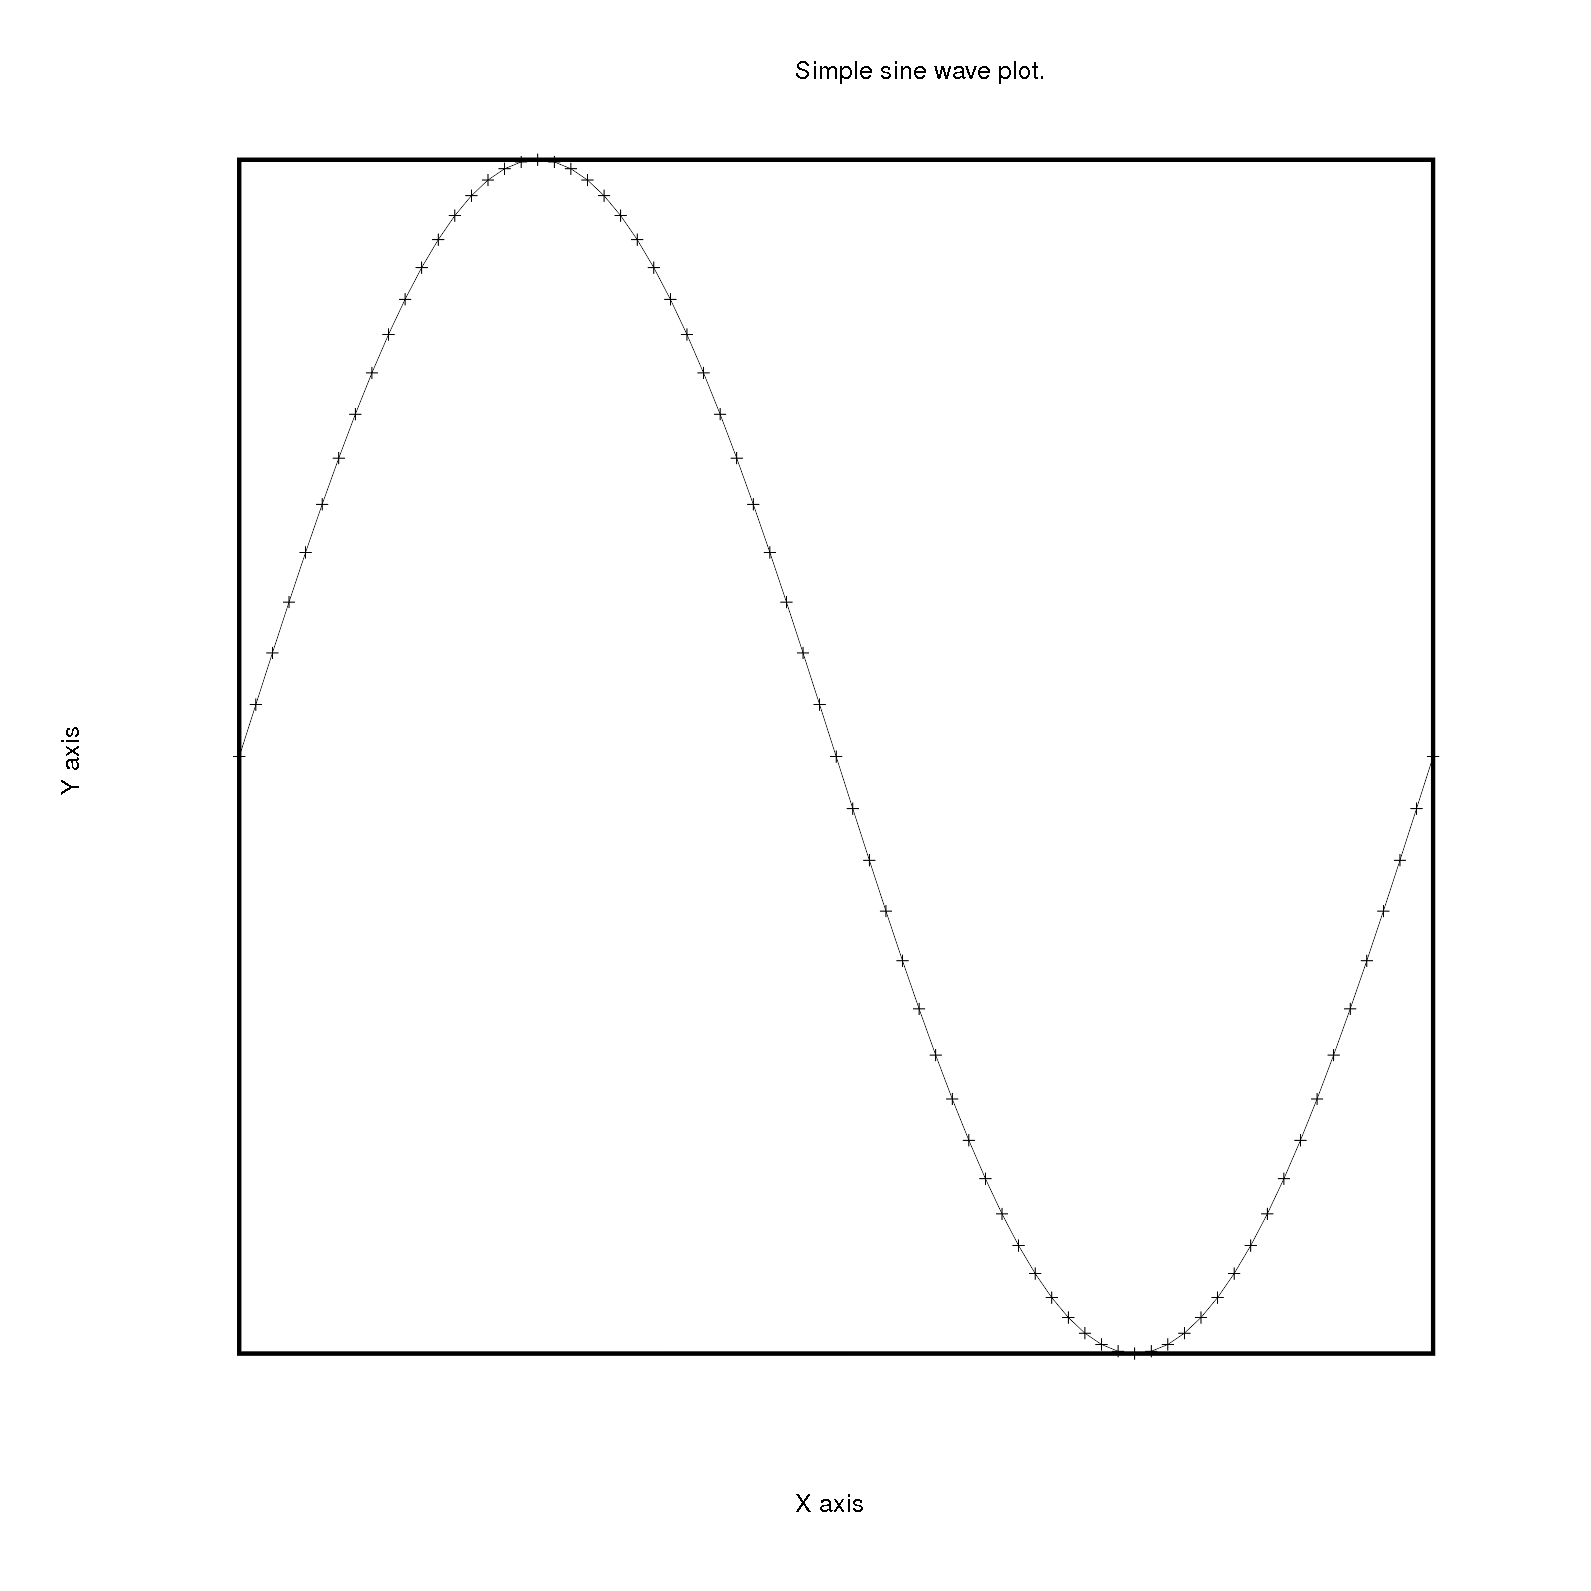
1
@figure = Rubyplot::Figure.new(height: 40, width: 40, figsize_unit: :cm)
axes = @figure.add_subplot! 0,0
axes.plot! do |p|
  p.marker_type = :plus
  p.line_type = :solid
  d = (0..360).step(5).to_a
  p.data d, d.map { |a| Math.sin(a * Math::PI / 180) }
end
axes.title = "Simple sine wave plot."
@figure.write('plot1.png')
Backend: Magick
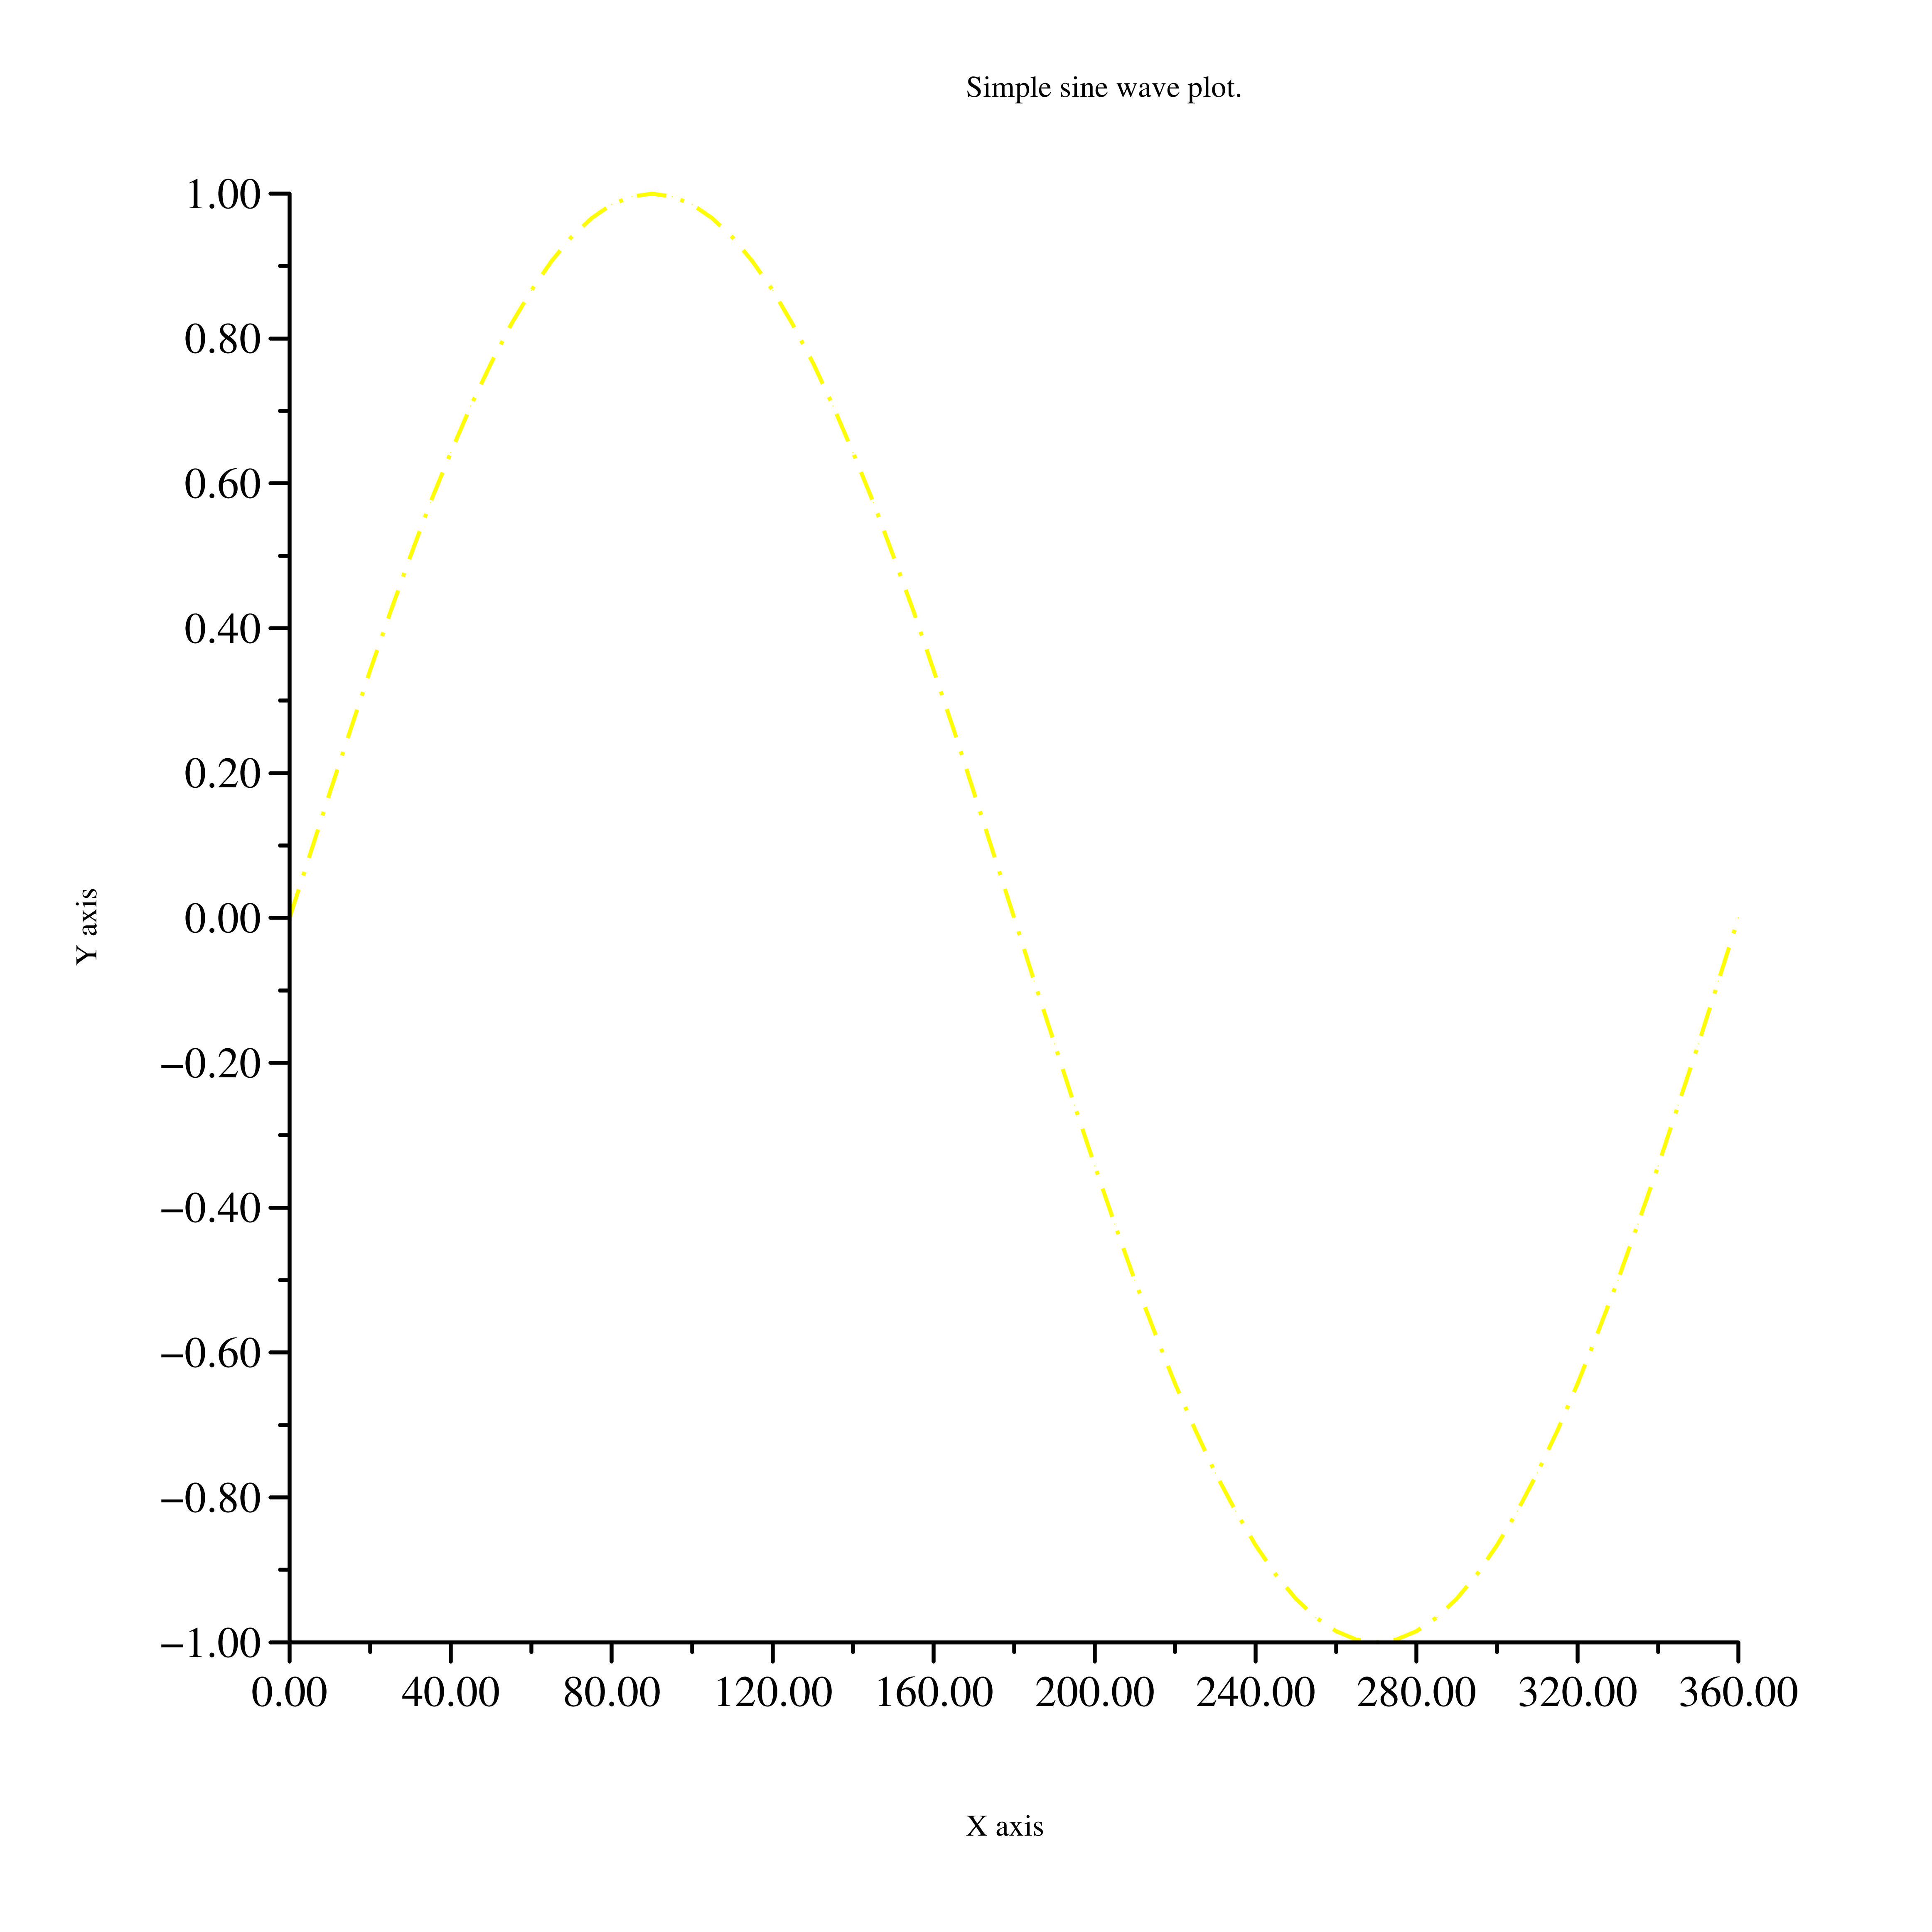
2
@figure = Rubyplot::Figure.new(height: 40, width: 40, figsize_unit: :cm)
axes = @figure.add_subplot! 0,0
axes.plot! do |p|
  p.line_type = :solid
  p.fmt = 'y-.'
  d = (0..360).step(5).to_a
  p.data d, d.map { |a| Math.sin(a * Math::PI / 180) }
end
axes.title = "Simple sine wave plot."
@figure.write('plot2.png')
Backend: GR
Here, the fmt argument sets the colour and overwrites the line type.
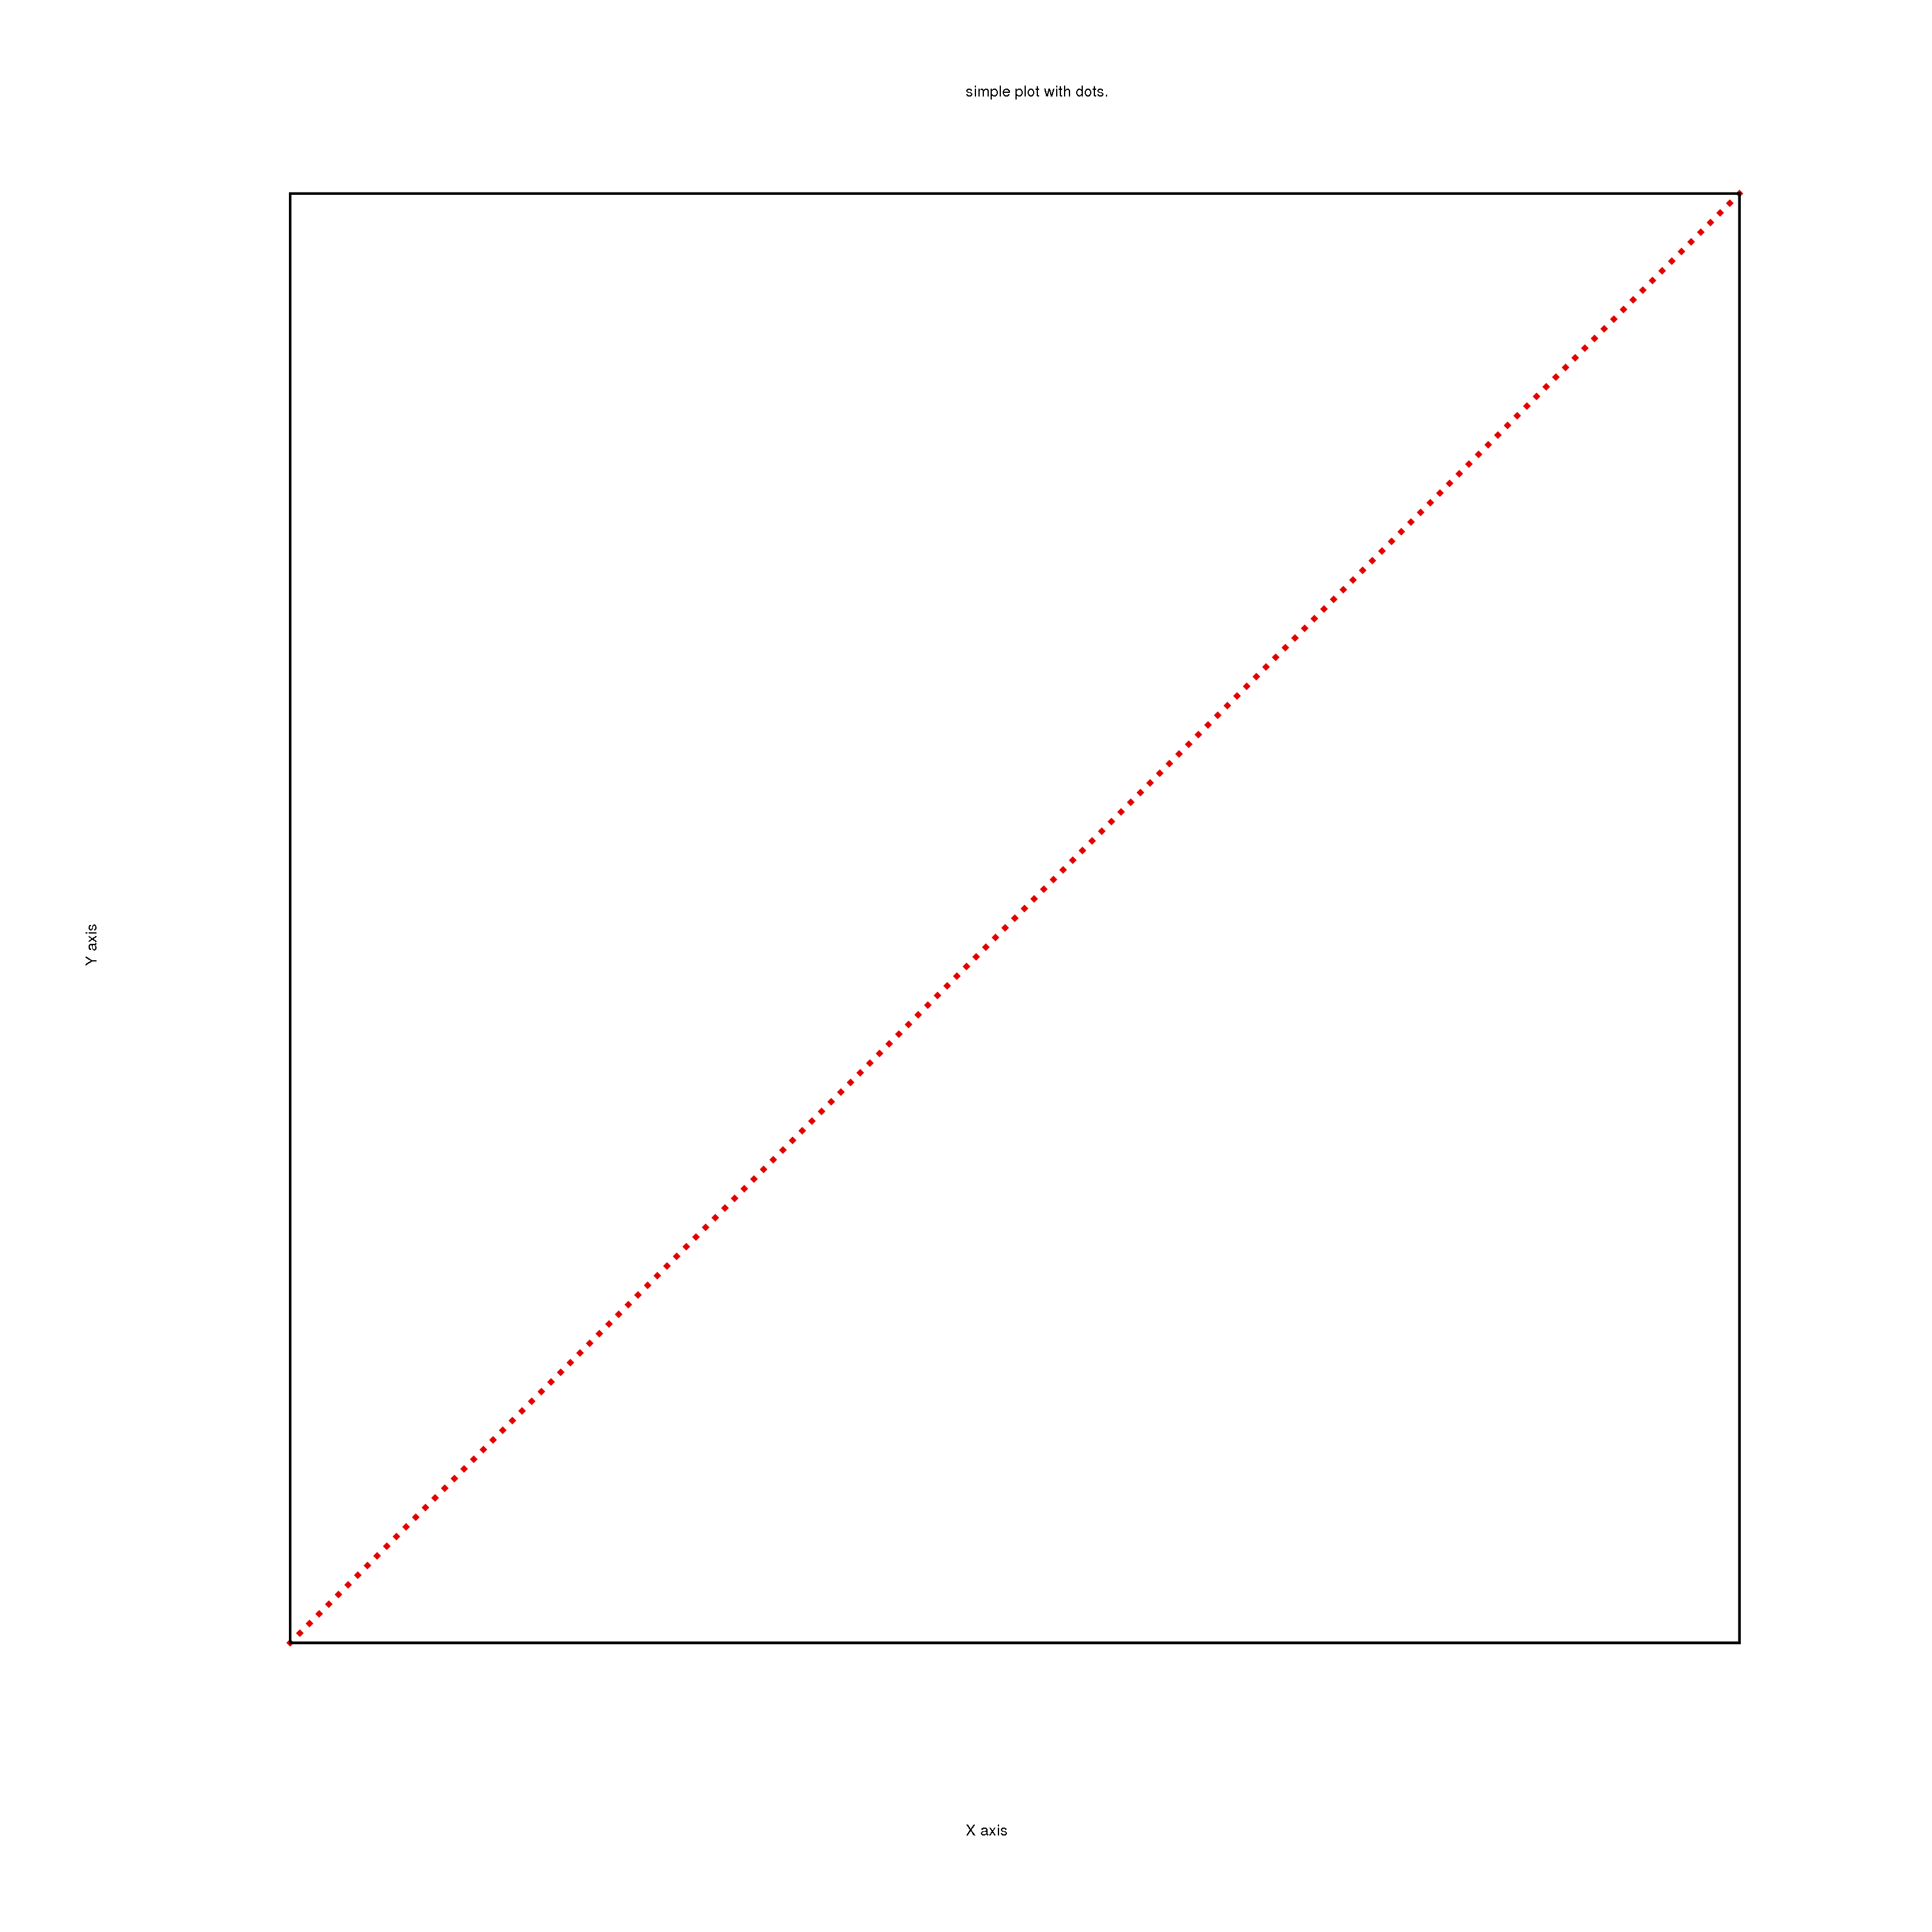
3
@figure = Rubyplot::Figure.new(height: 80, width: 80)
axes = @figure.add_subplot! 0,0
axes.plot! do |p|
  p.fmt = 'rD'
  p.data (0..150).to_a, (-100..50).to_a
end
axes.title = "simple plot with dots."
@figure.write('plot3.png')
Backend: Magick
Enjoy Reading This Article?
Here are some more articles you might like to read next: