The Scatter plot example
Summary: Explaining the scatter plot example.
Table of Contents
- Introduction
- The Example code
- An overview
- Code Explanation
Introduction
In the project introduction blog [Link] a scatter plot example was given, I will be explaining the technical details for that example which involves explaining the code for the library using Magick backend.
P.S. - This blog is targeted towards new developers who want to get familiar with the codebase of the library or anyone who is extremely interested in technical code details as this blog is very technical and requires some familiarity with Rubyplot and rmagick.
P.S. - The version of the library used for this example is of date 9 June.
The Example code
require 'Rubyplot'
@xdata = [1, 2, 3, 4, 5] # Defining X data
@ydata = [11, 2, 33, 4, 65] # Defining Y data
@figure = Rubyplot::Figure.new # Creating the canvas
axes = @figure.add_subplot! 0,0 # Adding a subplot (0,0 as only one subplot is to be plotted)
axes.scatter! do |p| # Setting scatter as the type of subplot
  p.data @x1, @y1 # setting data to be plotted
  p.label = "data1" # defining label for the data
  p.marker_border_color = :blue # defining border colour of the markers
  p.marker_fill_color = :blue # defining fill colour of the markers
  p.marker_type = :circle # defining marker type
end
axes.title = "Nice plot" # defining title of the plot
axes.x_title = "X data" # defining title of X axis
axes.y_title = "Y data" # defining title of Y axis
@figure.write("scatterplot.png") # Drawing the figure and saving it
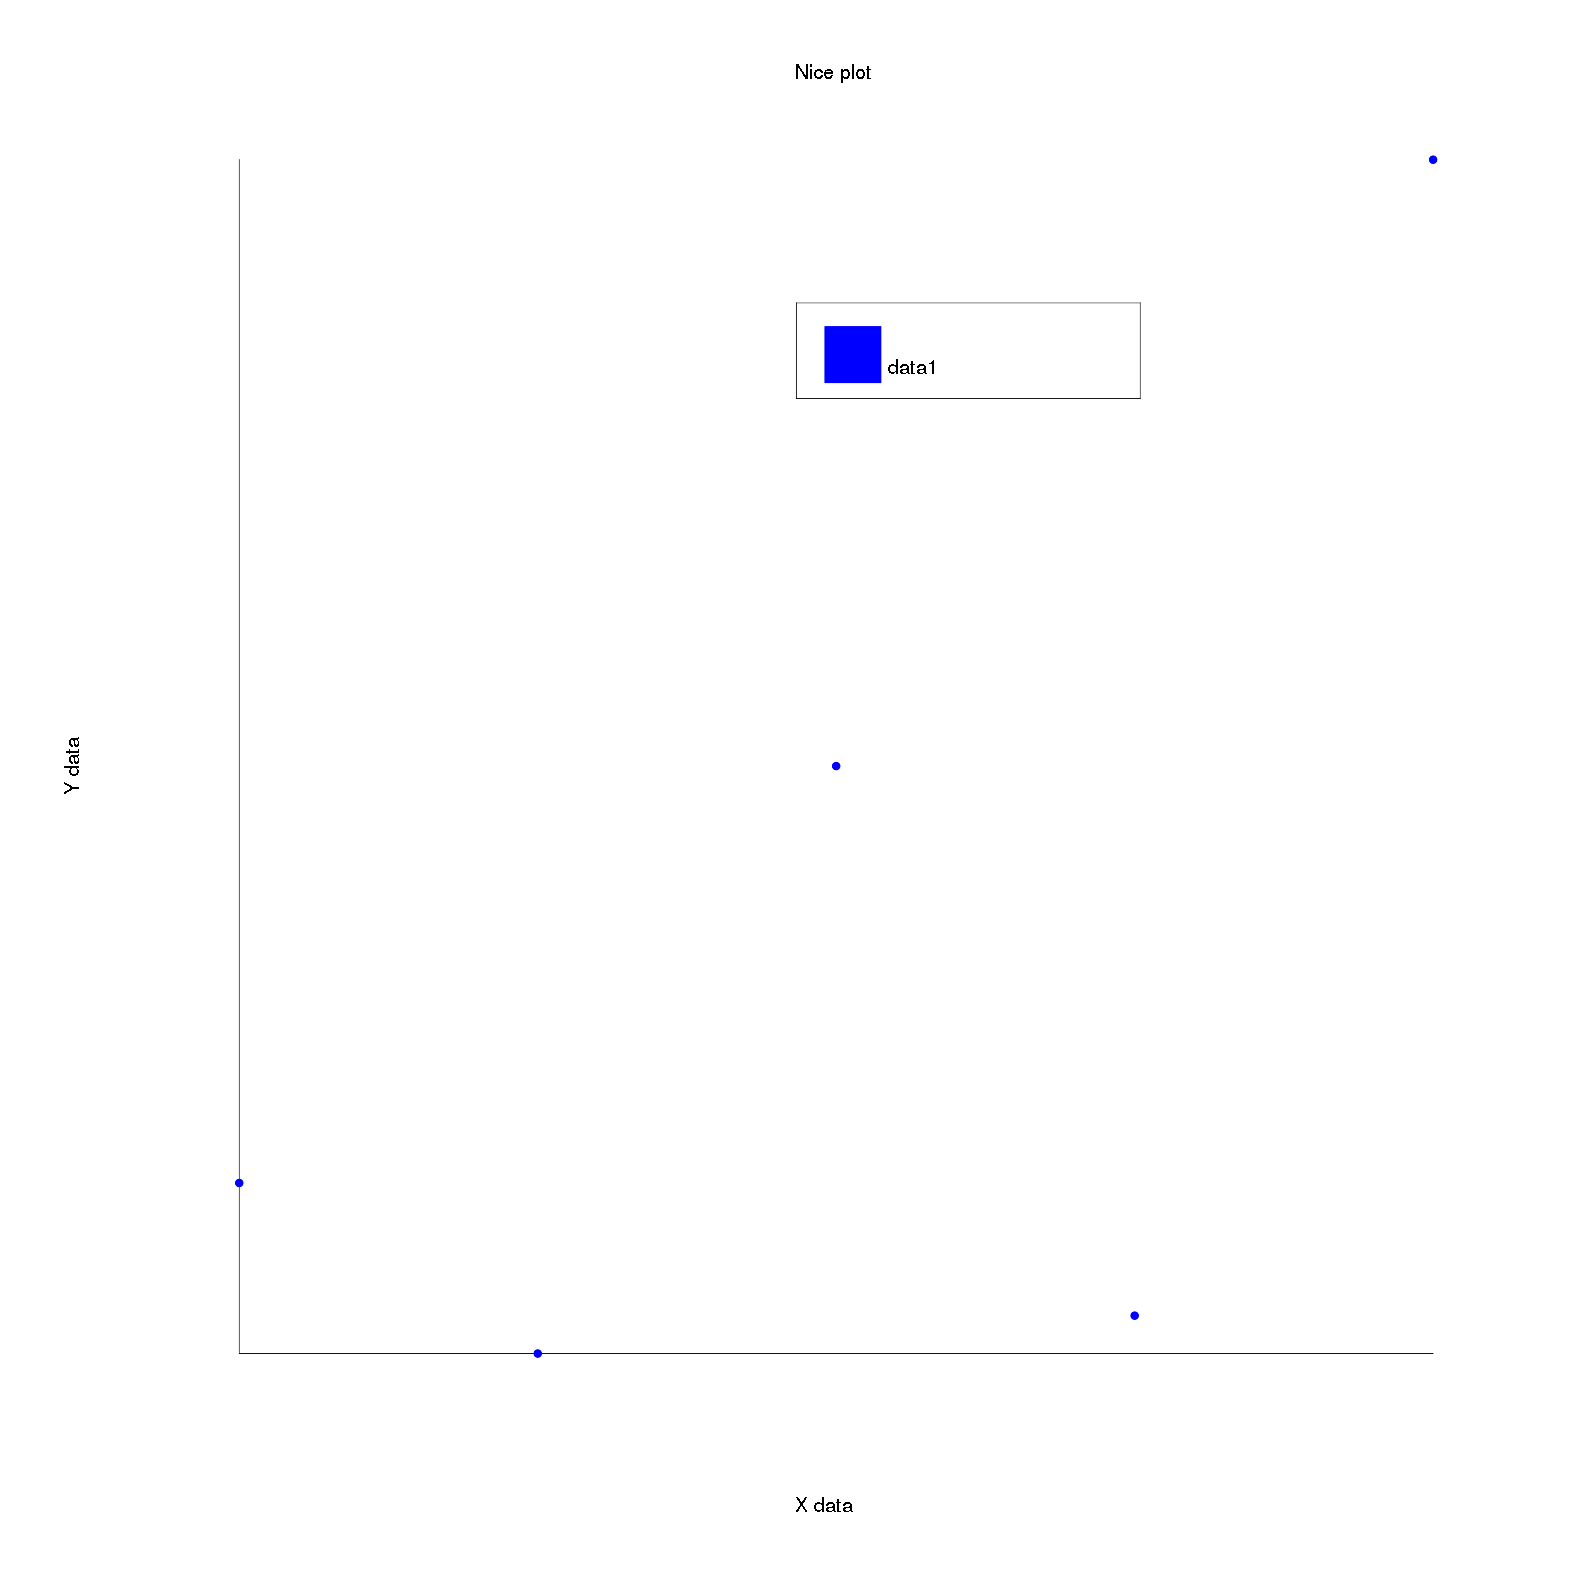
The output using Magick backend is:
An overview
An overview of how the code works is that it first creates the canvas(figure) on which everything will be drawn, then the space for subplots is created in this figure and then the subplots are added. When a subplot is added, the type of the subplot (i.e. the plots in this particular subplot), the properties of the subplot, the data for the plots in this subplot, the title for the X axis, Y axis and the subplot itself etc. are defined. After setting the properties of all the subplots, the write function is called to actually draw and save the figure. During drawing everything is drawn including the Legendbox of the subplots.
So, creating any figure in Rubyplot can be broken down into these steps:
- Create the Figure with desired properties.
- Define the number of subplots desired and thus the space for these subplots is created.
- Create the subplots one by one and set the desired properties of all the subplots.
- Call the
writefunction to actually draw the Figure and thus the desired figure is created, drawn and saved.
Code Explanation
So to go through the code let’s start with the first 3 lines
require 'Rubyplot'
@xdata = [1, 2, 3, 4, 5] # Defining X data
@ydata = [11, 2, 33, 4, 65] # Defining Y data
First Rubyplot is included which is similar to import in Python, this allows us to use Rubyplot. Next, we define 2 arrays xdata and ydata which store the X and Y coordinates to be plotted. So, the points to be plotted are (1,11), (2,2), (3,33), (4,4) and (5,65).
Figure
After this, we create a new Figure object which will act as the canvas on which image will be drawn.
@figure = Rubyplot::Figure.new # Creating the canvas
Creating a figure object calls the constructor of the figure class.
def initialize(height: nil, width: nil, figsize_unit: :cm)
    super(0, 0)
    @title = ''
    @nrows = 1
    @ncols = 1
    @width = (width || DEFAULT_CANVAS_DIM).to_f
    @height = (height || DEFAULT_CANVAS_DIM).to_f
    @top_spacing = 5
    @bottom_spacing = 5
    @left_spacing = 5
    @right_spacing = 5
    @subplots = nil
    @figsize_unit = figsize_unit
    set_rubyplot_artist_coords!
    setup_default_theme
    add_subplots! @nrows, @ncols
end
Here, height and width represent the height and width of the canvas to be made respectively. figsize_unit is for saving the unit for measurement which are pixel, centimeter or inch (default is cm).
Now, the Figure class inherits the Base class which initializes the origin for the figure in Rubyplot Coordinates which is set to 0,0.
After this default values are given to the required variables which include width and height set at 40 cm, spacing variables are for the margin for the figure (in pixels), nrows and ncols are the number of rows and columns in which each (row, column) represents a subplot, subplots variable is a 2-D array for storing subplots(which are axes objects), title is the title of the figure. Now, the function set_rubyplot_artist_coords! is called:
def set_rubyplot_artist_coords!
  @max_x = 100.0
  @max_y = 100.0
  @min_x = 0.0
  @min_y = 0.0
  if @height > @width
    aspect_ratio = @height / @width
    @max_y = @max_y * aspect_ratio
  elsif @height < @width
    aspect_ratio = @width / @height
    @max_x = @max_x * aspect_ratio
  end
end
This sets the maximum and minimum coordinates for Rubyplot in Rubyplot coordinates and so the figure has an X and Y range as [0, max] for both X and Y coordinates in Rubyplot coordinates. Then this function defines the aspect_ratio and then changes the maximum value and the range for X or Y depending on the canvas height and width.
After this, the function setup_default_theme is called which initializes some useful variables for the colour of the figure:
def setup_default_theme
  defaults = {
    marker_color: :white,
    font_color: :black,
    background_image: nil
  }
  @theme_options = defaults.merge Themes::CLASSIC_WHITE
  @marker_color = @theme_options[:marker_color]
  @font_color = @theme_options[:font_color] || @marker_color
end
First a defaults hash is defined which stores the default values of marker_color as the symbol :white which represents white colour, font_color as :black and background_image colour as nil. Then the empty theme_options hash is merged with a hash present in Themes module named CLASSIC_WHITE:
# Plain White background with no gradient.
CLASSIC_WHITE = {
  marker_color: 'black',
  font_color: 'black',
  background_colors: %I[white white],
  label_colors: %I[strong_blue vivid_orange dark_lime_green strong_red slightly_desaturated_violet dark_grey strong_yellow strong_cyan yellow maroon grey]
}.freeze
This hash which is now equal to theme_options has default values and represents a White background with no gradient.
After merging the values of marker_color and theme_color are set according to the theme_options hash defaults.
Now the function add_subplots! is called which creates and initializes the subplots array:
def add_subplots!(nrows, ncols)
  @nrows = nrows
  @ncols = ncols
  @subplots = Array.new(@nrows) { Array.new(@ncols) { nil } }
end
The subplots array is of dimension nrows x ncols.
Adding a subplot
After creating the figure, we move to adding subplots. To add a subplot the function add_subplot! is called
axes = @figure.add_subplot! 0,0
But first, we need to call the function add_subplots! to create the space for subplots i.e. initialize the subplots array and define the number of subplots. In this example, 0,0 specifies that only 1 subplot is to be created and we have already created the space for it(during initialization of the Figure) and so we don’t need to do it again.
Now, the function add_subplot! is called for our figure object:
def add_subplot!(nrow, ncol)
  plottable_width = (@max_x - (@left_spacing + @right_spacing)).to_f
  plottable_length = (@max_y - (@top_spacing + @bottom_spacing)).to_f
  @subplots[nrow][ncol] = Rubyplot::Artist::Axes.new(
    self,
    abs_x: @left_spacing + (plottable_width / @ncols) * ncol,
    abs_y: @bottom_spacing + (plottable_length / @nrows) * nrow,
    width: plottable_width / @ncols,
    height: plottable_length / @nrows
  )
  @subplots[nrow][ncol]
end
This function takes input the row and coloumn for the subplot which is 1,1 in our case but is stored as 0,0 in the subplots array. First, plottable_width and plottable_length are calculated in Rubyplot coordinate units which define the total space measurements in which plotting is allowed i.e. incorporating the spacing for the figure. Then a new Axes object is made and is stored in the subplots array at the index 0,0. The function then returns the subplots array at index 0,0 which is stored in axes variable.
Axes
Now the axes variable contains an initialized Axes object which is also stored in subplots array at index 0,0. The Axes initialization is as follows:
def initialize(figure, abs_x:, abs_y:, width:, height:)
  @figure = figure
  @abs_x = abs_x
  @abs_y = abs_y
  @width = width
  @height = height

  @x_title = ''
  @y_title = ''
  @top_margin = 5.0
  @left_margin = 10.0
  @bottom_margin = 10.0
  @right_margin = 5.0
  @title = ''
  @title_shift = 0
  @title_margin = TITLE_MARGIN
  @text_font = :default
  @grid = true
  @bounding_box = true
  @plots = []
  @raw_rows = width * (height/width)
  @theme = Rubyplot::Themes::CLASSIC_WHITE
  @font = :times_roman
  @font_color = :black
  @font_size = 15.0
  @legend_font_size = 20.0
  @legend_margin = LEGEND_MARGIN
  @title_font_size = 25.0
  @plot_colors = []
  @legends = []
  @lines = []
  @texts = []
  @x_axis = Rubyplot::Artist::XAxis.new(self)
  @y_axis = Rubyplot::Artist::YAxis.new(self)
  @legend_box_position = :top
end
The inputs are the figure to which this axes belongs which was given by self, axs_x and abs_y are the X and Y coordinate of this axes’s lower left corner in Rubyplot coordinates and the width and height are the allowed space for this subplot i.e. the area in which this subplot is to be drawn.
Other important variables initialized margin variables which define the margin for this subplot(axes object), plots array which stores the plots to be drawn in this subplot, xaxis and yaxis which are an object of XAxis and YAxis respectively.
So, after initializing this axes object is stored in axes variable and subplots array at index 0,0.
X Axis and Y axis
We have initialized the variables x_axis and y_axis with new XAxis and YAxis objects, so when these objects are created, their constructor is called i.e. initialize function:
# X Axis constructor
def initialize axes
  super
end

# Y axis constructor
def initialize(*)
  super
end
So, both these classes inherit the Base of Axis and in the constructor of both of these classes, the constructor of Base is called:
def initialize axes
  @axes = axes
  @title = ''
  @min_val = nil
  @max_val = nil
  @major_ticks_count = 5
  @minor_ticks_count = 2
  @texts = []
  @lines = []
  @major_ticks = nil
  @minor_ticks = nil
  @title_font_size = 25.0
end
This constructor sets various useful properties of X and Y axes to their default values. It takes the axes object as an input to store it into axes variable to store the axes object to which it belongs, next the title is set to empty and the max_val and the min_val are stored to nil which store the maximum and minimum value of the X and the Y axes, next the number of major and minor ticks (between two major ticks) are stored, then two arrays are initialized texts and lines (not actually used) to store the texts and lines (tick lines not actual axis lines) for the X and Y axes, then the variables major_ticks and minor_ticks are set to nil which are used as arrays to store XTick and YTick objects corresponding to major(and minor) ticks of X-axis and major(and minor) ticks of Y-axis respectively. Finally, the font size of the title is set to 25 points.
The Plot
Now, we have defined the subplot i.e. the axes object in which we want to draw our plot. The next lines of code are:
axes.scatter! do |p| # Setting scatter as the type of subplot
  p.data @x1, @y1 # setting data to be plotted
  p.label = "data1" # defining label for the data
  p.marker_border_color = :blue # defining border colour of the markers
  p.marker_fill_color = :blue # defining fill colour of the markers
  p.marker_type = :circle # defining marker type
end
So, the function scatter! is called for the axes object. The block associated with the scatter! function is:
p.data @x1, @y1 # setting data to be plotted
p.label = "data1" # defining label for the data
p.marker_border_color = :blue # defining border colour of the markers
p.marker_fill_color = :blue # defining fill colour of the markers
p.marker_type = :circle # defining marker type
The block is a block of lines having commands which in this example are used for specifying properties of the plot in the subplot. This block is given to the scatter! function as an input:
def scatter!(*_args, &block)
  add_plot! :Scatter, &block
end
This function calls the private add_plot! function:
def add_plot! klass, &block
  plot = Kernel.const_get("Rubyplot::Artist::Plot::#{klass}").new self
  yield(plot) if block_given?
  @plots << plot
end
The add_plot! function takes input as the class name for the plot which is Scatter in this example and the block is passed, then using Kernel a new object of the input class is created and is stored in plot variable which in this example is Scatter plot and so a Scatter object is created and stored in plot variable.
Then yield executes the block if block is given i.e. block_given?==true. After executing the block i.e. creating the plot and setting up the characteristics of the blog, the plot is appended in plots array.
Scatter Plot
Now, before executing to the block, a Scatter object is initialized:
def initialize(*)
  super
  @marker_size = 1.0
  @marker_type = :circle
  @marker_border_color = :black
  # set fill to nil for the benefit of hollow markers so that legend
  # color defaults to :black in case user does not specify.
  @marker_fill_color = nil
end
This first calls the base class which is inherited by Scatter, the initialize function is called. After that, different properties of the plot are set to default values which are stored in variables like marker size (set to 1), marker type (set to circle) which can be of different types like, triangle, plus, star, etc. (around 35 types available), marker border colour (set to black) and marker fill colour (set to nil). Now, the initialize function is:
def initialize axes
super(axes.abs_x, axes.abs_y)
  @axes = axes
  @data = {
    label: '',
    color: :default
  }
  @normalized_data = {
    y_values: nil,
    x_values: nil
  }
  @stroke_width = 4.0
  @stroke_opacity = 0.0
end
This again calls the base class of artist which is inherited by this base class, the initialize function is called. After that, an axes variable is initialized to store the axes pointer, a data hash is initialized which stores different properties of the subplot like label and colour for the legend, a normalized_data hash is initialized to store normalised data (not used), stroke width and stroke opacity (i.e. border width and opacity) are initialized with values 4 and 0 respectively. The initialize function is:
def initialize(abs_x, abs_y)
  @abs_x = abs_x
  @abs_y = abs_y
end
This initialized function sets the absolute values (i.e. in Rubyplot coordinates) of the origin of this axes object i.e. of this subplot (which is the upper left corner for Magick backend).
The Block (properties of the scatter plot)
Now, the scatter object has been initialized and the block will be executed which sets the data to be plotted and other properties of the scatter plot. The block is:
p.data @x1, @y1 # setting data to be plotted
p.label = "data1" # defining label for the data
p.marker_border_color = :blue # defining border colour of the markers
p.marker_fill_color = :blue # defining fill colour of the markers
p.marker_type = :circle # defining marker type
Here p is the scatter plot object. First, the data is set to the x1 and the y1 arrays defined earlier:
# Function in base of plots
def data(x_values, y_values)
  @data[:x_values] = x_values
  @data[:y_values] = y_values
end
This stores the x_vales and y_values in the data hash. Then the label of the scatter plot is set:
# Function in base of plots
def label=(label)
  @data[:label] = label
end
This overwrites the value of label in data hash.
Next, marker_border_color is set which is a variable of scatter plot which describes the colour of the border of the markers. So, in this example the colour is set to blue i.e. the variable marker_border_color is set to the symbol :blue.
Next, marker_fill_color is set which is a variable of scatter plot which describes the colour to be filled in the markers. So, in this example the colour is set to blue i.e. the variable marker_fill_color is set to the symbol :blue.
Finally, the marker type is set to circle i.e. the variable marker_type is set to the symbol :circle.
Axes properties (properties of the subplot)
Finally after setting the scatter plot properties, the properties of the subplot i.e. the axes object are set:
axes.title = "Nice plot" # defining title of the plot
axes.x_title = "X data" # defining title of X axis
axes.y_title = "Y data" # defining title of Y axis
Axes object has these variables title, x_title, y_title which store a string which defines the title of the subplot, title of X-axis and title of Y-axis respectively.
Writing Figure
Till now we have only defined the properties and the data of the figure and have not actually plotted anything. Also notice that till now we haven’t actually made of the use of backend and have only used the frontend, one aim of Rubyplot is having a backend-agnostic frontend i.e. frontend should not be dependent on the backend.
Now we finally call the write function of the figure which actually draws everything and stores the figure as an Image:
@figure.write("scatterplot.png") # Drawing the figure and saving it
Now, the write function of figure is:
def write(file_name, device: :file)
  Rubyplot.backend.canvas_height = @height
  Rubyplot.backend.canvas_width = @width
  Rubyplot.backend.figure = self
  if ENV["RUBYPLOT_BACKEND"] == "MAGICK"
    set_background_gradient
  end
  Rubyplot.backend.init_output_device(file_name, device: :file)
  @subplots.each { |i| i.each(&:process_data) }
  @subplots.each { |i| i.each(&:draw) }
  Rubyplot.backend.write
  Rubyplot.backend.stop_output_device
end
Now, we start using the backend (it is initialized) and setting its properties, first the variables canvas_height and canvas_width are sset as the height and width of the canvas (figure), then the figure variable points to the Figure object.
Now the function set_background_gradient is called which is exclusive to Magick backend and its purpose is to make the canvas i.e. an Magick::Image object (P.S. - In future, this function will be shifted to the backend so that both backends are consistent).
Initializing the backend
When any function or variable of the backend is called for the first time, the backend is initialized and its constructor is called:
def initialize
  @axes_map = {}
end
In Magick backend, during initialization an axes_map hash is defined which will later be used to store properties for X and Y axis corresponding to this particular axes which are currently being used.
Setting up the background gradient (creating the Figure)
Now, the set_background_gradient function is:
def set_background_gradient
  Rubyplot.backend.set_base_image_gradient(
    Rubyplot::Color::COLOR_INDEX[@theme_options[:background_colors][0]],
    Rubyplot::Color::COLOR_INDEX[@theme_options[:background_colors][1]],
    @width,
    @height,
    @theme_options[:background_direction]
  )
end
This function calls the set_base_image_gradient function in the backend which creates the base_image variable which stores the Magick::Image object which is the canvas on which everything will be drawn, the canvas backgroung can have any solid colour or a gradient of two colours.
The first inputs given are the background top and bottom colour for the background gradient of the figure (theme_options hash was set up while initializing the figure), then the width and height of the figure and finally the gradient direction is set which is nil currently and will get take on the default value later.
Now, the set_base_image_gradient function is:
def set_base_image_gradient(top_color, bottom_color, width, height, direct=:top_bottom)
  @base_image = render_gradient top_color, bottom_color, width, height, direct
end
So the inputs to this are as explained above and the direction of the gradient is set to the symbol :top_bottom. So, the variable base_image is created which stores the Magick::Image object which is the figure, the value of base_image is returned by the function which is render_gradient which takes the same inputs as set_base_image_gradient, this function is:
# Render a gradient and return an Image.
def render_gradient(top_color, bottom_color, width, height, direct)
  width, height = scale_figure(width, height)
  gradient_fill = case direct
                  when :bottom_top
                    GradientFill.new(0, 0, 100, 0, bottom_color, top_color)
                  when :left_right
                    GradientFill.new(0, 0, 0, 100, top_color, bottom_color)
                  when :right_left
                    GradientFill.new(0, 0, 0, 100, bottom_color, top_color)
                  when :topleft_bottomright
                    GradientFill.new(0, 100, 100, 0, top_color, bottom_color)
                  when :topright_bottomleft
                    GradientFill.new(0, 0, 100, 100, bottom_color, top_color)
                  else
                    GradientFill.new(0, 0, 100, 0, top_color, bottom_color)
                  end
  Magick::Image.new(width, height, gradient_fill)
end
Now first the scale_figure function is called which scales the figure according to the unit of dimensions of the figure (stored in figsize_units) to pixels as Magick backend uses pixels as its unit. After scaling the figure the gradient of the figure background is stored in gradient_fill, this is a GradientFill object from ImageMagick which takes the inputs x,y coordinates of starting and ending of the gradient and the starting and ending colours.
Now, a new Magick::Image object is created (with the properties set) and returned which gets stored in base_image.
The scale_figure function is:
# Function to convert figure size to pixels
def scale_figure(width, height)
  [width * PIXEL_MULTIPLIERS[@figure.figsize_unit], height * PIXEL_MULTIPLIERS[@figure.figsize_unit]]
end
So, in this function the width and height are multiplied with constants stored in PIXEL_MULTIPLIERS hash, i.e. to convert from inch to pixels, the width and size are multiplied with a constant. The PIXEL_MULTIPLIERS hash is:
# Multiplier needed to convert given unit into pixels. (Magick default).
PIXEL_MULTIPLIERS = {
  inch: 96,
  cm: 39.7953,
  pixel: 1
}.freeze
Setting up the Output device
After setting up the background gradient, the init_output_device function is called:
Rubyplot.backend.init_output_device(file_name, device: :file)
This function takes input as the name of the image to be written and saved and the device to which it is to be saved which by default is :file symbol which represents the current folder of Rubyplot (device attribute is not used currently). The init_output_device function is:
def init_output_device file_name, device: :file
  @canvas_width, @canvas_height = scale_figure(@canvas_width, @canvas_height)
  @draw = Magick::Draw.new
  @axes = Magick::Draw.new
  @text = Magick::Draw.new
  @file_name = file_name
end
This first modifies the canvas_width and the canvas_height variables according to the unit of the figure (scale_figure function was explained earlier). Then three new variables are defined draw, axes and text which are Magick::Draw objects which are used to draw shapes, X/Y axes and text respectively. Finally the file_name variable stores the file name string.
Processing the data in subplots
Now, First the data in subplots is processed:
@subplots.each { |i| i.each(&:process_data) }
For each subplot (axes object) stored in subplots array the function process_data is called:
def process_data
  assign_default_label_colors
  consolidate_plots
  @plots.each(&:process_data)
  set_axes_ranges
end
This first calls the function assign_default_label_colors which sets the default colours for the each of the plots in this subplot, the function is:
def assign_default_label_colors
  @plots.each_with_index do |p, i|
    if p.color == :default
      p.color = @figure.theme_options[:label_colors][
        i % @figure.theme_options[:label_colors].size]
    end
  end
end
In this function, for each plot in plots array (in this example only 1 scatter plot) the default colours are set, the value returned by the color function is checked and if it is :default then the default colours are set, the color function is:
def color
  @marker_fill_color || @marker_border_color || :default
end
This function returns the first value which is not nil (will return :default if both variables are nil).
So, this returns :default which causes the assign_default_label_colors function to go into the if case, and a colour is set using the color function, the colour set is decided by the theme_options hash using the key :label_colors which has an array of colours and the colour at the index ` i % @figure.theme_options[:label_colors].size` and in this example i = 0 since there is only one plot and the :label_colors variable is set to default (so 0 index is chosen and the colour present at 0 index is strong_blue). The color function used for setting colours is:
# Set both marker_fill_color and marker_border_color to the same color.
def color= color
  @marker_fill_color = color
  @marker_border_color = color
end
So, marker_fill_color and marker_border_color are set to the colour which was chosen as default i.e. strong_blue in this example.
Now, next the function consolidate_plots is called:
def consolidate_plots
  bars = @plots.grep(Rubyplot::Artist::Plot::Bar)
  unless bars.empty?
    @plots.delete_if { |p| p.is_a?(Rubyplot::Artist::Plot::Bar) }
    @plots << Rubyplot::Artist::Plot::MultiBars.new(self, bar_plots: bars)
  end

  stacked_bars = @plots.grep(Rubyplot::Artist::Plot::StackedBar)
  unless stacked_bars.empty?
    @plots.delete_if { |p| p.is_a?(Rubyplot::Artist::Plot::StackedBar) }
    @plots << Rubyplot::Artist::Plot::MultiStackedBar.new(self, stacked_bars: stacked_bars)
  end

  candle_sticks = @plots.grep(Rubyplot::Artist::Plot::CandleStick)
  unless candle_sticks.empty?
    @plots.delete_if { |p| p.is_a?(Rubyplot::Artist::Plot::CandleStick) }
    @plots << Rubyplot::Artist::Plot::MultiCandleStick.new(self,
      candle_sticks: candle_sticks)
  end

  box_plots = @plots.grep(Rubyplot::Artist::Plot::BoxPlot)
  unless box_plots.empty?
    @plots.delete_if { |p| p.is_a?(Rubyplot::Artist::Plot::BoxPlot) }
    @plots << Rubyplot::Artist::Plot::MultiBoxPlot.new(self,
      box_plots: box_plots)
  end
end
This function checks if multiple bar plots/stacked bar plots/candle stick plots/box plots are present and if there are multiple of these plots then a new multi bar plot/multi stacked bar plot/multi candle stick plot/multi box plot is created correspondingly. In this example no such plot is present and hence the function does not do anything.
Next, for each plot present in this subplot i.e. in the plots array, the process_data function is called. In this example only one scatter plot is present and hence the process_data function of scatter plot is called (which is inherited from the base and is present in the base):
def process_data
  @y_min = @data[:y_values].min
  @y_max = @data[:y_values].max
  @x_min = @data[:x_values].min
  @x_max = @data[:x_values].max
end
This function stores the maximum and minimum X and Y values in the corresponding variables.
Finally, the set_axes_ranges function is called:
def set_axes_ranges
  set_xrange
  set_yrange
end
This function calls the functions set_xrange and set_yrange which are:
def set_xrange
  if @x_axis.min_val.nil?
    @x_axis.min_val = @plots.map(&:x_min).min
  end

  if @x_axis.max_val.nil?
    @x_axis.max_val = @plots.map(&:x_max).max
  end
end

def set_yrange
  if @y_axis.min_val.nil?
    @y_axis.min_val = @plots.map(&:y_min).min
  end

  if @y_axis.max_val.nil?
    @y_axis.max_val = @plots.map(&:y_max).max
  end
end
Both of these functions first check if the corresponding maximum and minimum values are nil or not (which they are by default) in x_axis and y_axis which store the XAxis and YAxis objects respectively, and if they are nil (which they are in this example currently) then it calculates the minimum and maximum values across all the plots present in this subplot(i.e. in the plots array) and then sets the corresponding variables to the corresponding values.
Drawing the Subplots
Next each subplot in subplots array is drawn:
@subplots.each { |i| i.each(&:draw) }
The draw function of axes is:
# Write an image to a file by communicating with the backend.
def draw
  Rubyplot.backend.active_axes = self
  configure_title
  configure_legends
  assign_x_ticks
  assign_y_ticks
  @x_axis.draw
  @y_axis.draw
  @texts.each(&:draw)
  @legend_box.draw
  @plots.each(&:draw)
end
First the active_axes variable is set to the current axes object which is to be drawn, next the function configure_title is called:
# Figure out the co-ordinates of the title text w.r.t Axes.
def configure_title
  @texts << Rubyplot::Artist::Text.new(
    @title, self,
    abs_x: abs_x + width / 2, abs_y: abs_y + height,
    font: @font, color: @font_color,
    size: @title_font_size, internal_label: 'axes title.')
end
This function sets the title of this subplot (in this example the title is set to ‘Nice plot’). So a new Text object is added to the texts array of the active axes, the inputs for initializing the Text object are first the text, then the owner of this text i.e. the active axes, then the x coordinate and y coordinate in Rubyplot coordinates, then the font, font colour, font size (in points) and an internal label. Currently, the position of title is kept static and is at the center of the width and at maximum height of the axes (adding these with the x and y origin values of the axes gives the Rubyplot coordinates of the text). The initialize function of Text is:
def initialize(text, owner, abs_x:, abs_y:,font: :times_roman,
  color: :black, size:, internal_label: '', rotation: nil,
  weight: nil, halign: :normal, valign: :normal, direction: :left_right)
  @abs_x = abs_x
  @abs_y = abs_y
  @text = text
  @owner = owner
  @font = font
  @color = color
  @size = size
  @internal_label = internal_label
  @rotation = rotation
  if HAlignment.include? halign
    @halign = halign
  else
    raise "Invalid horizontal alignment #{halign}."
  end

  if VAlignment.include? valign
    @valign = valign
  else
    raise "Invalid vertical alignment #{valign}."
  end
end
This sets all the required variables including the rotation for text if required and the alignment too.
Legend Box
After configuring the label, the function configure_legends is called:
# Figure out co-ordinates of the legends
def configure_legends
  @legend_box = Rubyplot::Artist::LegendBox.new(
    self, abs_x: legend_box_ix, abs_y: legend_box_iy
  )
end
This function creates a new LegendBox object which defines the legend of the subplot, the inputs given are the owner of this legend box i.e. the subplot, then the absolute value (i.e. in Rubyplot coordinates) of x and y coordinates which correspond to the lower right corner of the legend box. The functions legend_box_ix and legend_box_ix are called to give the absolute X and Y coordinate for the lower right corner of the legend box. The functions are:
# X co-ordinate of the legend box depending on value of @legend_box_position.
def legend_box_ix
  case @legend_box_position
  when :top
    abs_x + width / 2
  end
end

# Y co-ordinate of the legend box depending on value of @legend_box_position.
def legend_box_iy
  case @legend_box_position
  when :top
    abs_y + height - top_margin - legend_margin
  end
end
These functions set the X coordinate to center of width and Y coordinate to the maximum height of the axes excluding the corresponding margins.
The initialize function of the LegendBox is:
def initialize(axes, abs_x:, abs_y:)
  super(abs_x, abs_y)
  @axes = axes
  @border_color = :black
  @legends = []
  configure_dimensions
  configure_legends
  configure_legend_box
end
This first calls the initialize of parent class i.e. base:
def initialize(abs_x, abs_y)
  @abs_x = abs_x
  @abs_y = abs_y
end
which just sets the lower right coordinates of the legend box, next axes is set to its owner i.e. the subplot and then border_color of the legend box i.e. the colour of the outer rectangle of the legend box i.e. the colour of the box. Then the array legends is created which stores the legend objects. Next, the function configure_dimensions is called which sets the dimensions for the legend box:
def configure_dimensions
  @legends_height = @axes.plots.size * per_legend_height
  @legends_width = 0.2 * @axes.width
  @height = @legends_height + top_margin + bottom_margin
  @width = @legends_width + left_margin + right_margin
end
The functions called here are:
def top_margin
  TOP_SPACING_RATIO * @legends_height
end

def bottom_margin
  BOTTOM_SPACING_RATIO * @legends_height
end

def left_margin
  LEFT_SPACING_RATIO * @legends_width
end

def right_margin
  RIGHT_SPACING_RATIO * @legends_width
end

# Height of each legend in Rubyplot Artist Co-ordinates.
def per_legend_height
  5
end
So, in configure_dimensions first the total height of legends is set which is number of plots * height per legend (which is set to 5 Rubyplot coordinates), then the length of the legends is width of the subplot * 0.2, Then the total height and width for the legend box is calculated i.e. margins are incorporated (each margin ratio is set to 0.1).
After fixing the legend box dimensions, the legends are created which are Legend objects using the configure_legends function, which is:
def configure_legends
  @axes.plots.each_with_index do |plot, count|
    next unless plot.label != ''
    @legends << Rubyplot::Artist::Legend.new(
      self,
      @axes,
      text: plot.label,
      color: plot.color,
      abs_x: @abs_x + left_margin,
      abs_y: @abs_y + count * per_legend_height + bottom_margin,
    )
  end
end
This function creates a legend which is a Legend object having a square with the colour of the data and its label for every plot stored in the plots array. So for each plot a Legend object is made and added to the legends array, any plot with an empty label is skipped. The inputs given to create a new Legend object are first the owner of this legend i.e. the legend box, then the subplot to which it belongs i.e. the axes object, then the label of the plot, colour of the plot and finally the x,y coordinate of the lower left corner of the legend in Rubyplot coordinates. The initialize function of Legend is:
def initialize(legend_box, axes, text:, color:,abs_x:,abs_y:)
  super(abs_x, abs_y)
  @legend_box = legend_box
  @axes = axes
  @text = text
  @color = color
  @legend_box_size = @legend_box.per_legend_height -
                     (TOP_MARGIN + BOTTOM_MARGIN) # size of the color box of the legend.
  @font_size = 20.0
  @font = @axes.font
  @font_color = @axes.font_color
  configure_legend_color_box
  configure_legend_text
end
Here first the constructor(initialize function) of the parent class base is called which just sets the x,y coorindates of the lower left corner, then all the important variables are set according to the input and then the configure_legend_color_box is called which creates the square for the legend:
def configure_legend_color_box
  @legend_color_box = Rubyplot::Artist::Rectangle.new(
    self,
    x1: @abs_x,
    y1: @abs_y + BOTTOM_MARGIN,
    x2: @abs_x + @legend_box_size,
    y2: @abs_y + @legend_box_size + BOTTOM_MARGIN,
    border_color: @color,
    fill_color: @color,
    abs: true
  )
end
This function stores a Rectangle object in the variable legend_color_box. The inputs given to create a new Rectangle object are first the owner of the rectangle then the x,y coorindates of lower left and upper right corners, then the border colour and the colour to be filled and finally absolute flag representing whether the coordinates are in Rubyplot cooridnates(abs = True) or not(abs = False). The initialize function of Rectangle class is:
def initialize(owner,x1:,y1:,x2:,y2:,border_color:,fill_color: nil, abs: false)
  @x1 = x1
  @x2 = x2
  @y1 = y1
  @y2 = y2
  @border_color = border_color
  @fill_color = fill_color
  @abs = abs
end
This just sets all the variables according to the input.
Now, the configure_legend_text is called which creates the text for the legend:
def configure_legend_text
  @text = Rubyplot::Artist::Text.new(
    @text,
    self,
    abs_x: @abs_x + @legend_box_size + BOX_AND_TEXT_SPACE,
    abs_y: @abs_y + BOTTOM_MARGIN * 2,
    font: @font,
    color: @font_color,
    size: @font_size
  )
end
This function creates a Text object and stores it in the text variable. The inputs are given to create the Text object (Text object was discussed earlier), here the BOX_AND_TEXT_SPACE represents the space between the box and the text which is set to 0.5 .
So, after configuring the dimensions of the legend box and the legends, the legend box is configured by calling the configure_legend_box function:
def configure_legend_box
  @bounding_box = Rubyplot::Artist::Rectangle.new(
    self,
    x1: @abs_x,
    y1: @abs_y,
    x2: @abs_x + @width,
    y2: @abs_y + @height,
    border_color: @border_color,
    abs: true
  )
end
This function creates the bounding box which is the outer rectangle of the legend box. The bounding_box is a Rectangle object (which was discussed earlier).
X and Y ticks
Finally, the LegendBox object is created and we continue to the draw function of the axes i.e. the subplot.
Next the functions assign_x_ticks and assign_y_ticks are called which assign the ticks to the X and Y axes. The functions are:
def assign_x_ticks
  value_distance = @x_axis.spread / (@x_axis.major_ticks_count.to_f - 1)
  unless @x_axis.major_ticks # create labels if not present
    @x_axis.major_ticks = @x_axis.major_ticks_count.times.map do |i|
      @x_axis.min_val + i * value_distance
    end
  end

  unless @x_axis.major_ticks.all? { |t| t.is_a?(Rubyplot::Artist::XTick) }
    @x_axis.major_ticks.map!.with_index do |tick_label, i|
      Rubyplot::Artist::XTick.new(
        self,
        coord: i * value_distance + @x_axis.min_val,
        label: Rubyplot::Utils.format_label(tick_label)
      )
    end
  end
end

def assign_y_ticks
  value_distance = @y_axis.spread / (@y_axis.major_ticks_count.to_f-1)
  unless @y_axis.major_ticks
    @y_axis.major_ticks = (y_range[0]..y_range[1]).step(value_distance).map { |i| i }
  end

  unless @y_axis.major_ticks.all? { |t| t.is_a?(Rubyplot::Artist::YTick) }
    @y_axis.major_ticks.map!.with_index do |tick_label, i|
      Rubyplot::Artist::YTick.new(
        self,
        coord: @y_axis.min_val + i * value_distance,
        label: Rubyplot::Utils.format_label(tick_label)
      )
    end
  end
end
These functions decide the coordinates for the ticks according to the number of ticks required and then these functions create an array to store the ticks which are XTick and YTick objects. The ticks are of two types (both for X and Y axes), minor tick and major tick which represent a smaller and a bigger tick relatively (the size of the major tick is twice the size of minor tick).
P.S. - Currently the ticks are not implemented for Magick backend and changes are required in the frontend of ticks as well and hence ticks will be discussed in detail in a later blog.
X axis and Y axis
Now, returning to the draw function of the axes, we actually start to draw the plots (Notice, till now we haven’t actually drawn anything). So the next lines of code are:
@x_axis.draw
@y_axis.draw
The draw function of XAxis and YAxis objects (which were stored in the variables x_axis and y_axis respectively) is called to draw the axes:
# X Axis
def draw
  configure_title
  Rubyplot.backend.draw_x_axis(
    origin: @axes.origin[0],
    major_ticks: @major_ticks,
    minor_ticks: @minor_ticks,
    major_ticks_count: @major_ticks_count
  )
  @texts.each(&:draw)
end

# Y Axis
def draw
  configure_title
  Rubyplot.backend.draw_y_axis(
    origin: @axes.origin[1],
    major_ticks: @major_ticks,
    minor_ticks: @minor_ticks,
    major_ticks_count: @major_ticks_count
  )
  @texts.each(&:draw)
end
First both the X and Y axes call the function configure_title which sets the title of X axis and Y axis respectively:
# X Axis
def configure_title
  @title = 'X axis' if @title == ''
  @texts << Rubyplot::Artist::Text.new(
    @title,
    self,
    size: @title_font_size,
    abs_y: @axes.abs_y,
    abs_x: @axes.abs_x + @axes.width/2
  )
end

# Y Axis
def configure_title
  @title = 'Y axis' if @title == ''
  @texts << Rubyplot::Artist::Text.new(
    @title,
    self,
    rotation: -90.0,
    abs_x: @axes.abs_x,
    abs_y: @axes.abs_y + @axes.height / 2,
    size: @title_font_size
  )
end
This function first checks if the title is empty and if it is the title is set to ‘X axis’ and ‘Y axis’ for X axis and Y axis respectively, this is done to set the default titles. After modifying the title variable if needed, a new Text object (which was discussed earlier) for the title is added to the texts array for both X and Y axes.
One thing to note is that rotation is given to the Text object for the Y-axis as the text is to be printed vertically.
After configuring the title, the backend functions draw_x_axis and draw_y_axis are called:
def draw_x_axis(minor_ticks:, origin:, major_ticks:, major_ticks_count:)
  if @axes_map[active_axes.object_id].nil?
    @axes_map[@active_axes.object_id]={
      axes: @active_axes,
      x_origin: origin
    }
  else
    @axes_map[@active_axes.object_id].merge!(x_origin: origin)
  end
end

def draw_y_axis(minor_ticks:, origin:, major_ticks:, major_ticks_count:)
  if @axes_map[@active_axes.object_id].nil?
    @axes_map[@active_axes.object_id]={
      axes: @active_axes,
      y_origin: origin
    }
  else
    @axes_map[@active_axes.object_id].merge!(y_origin: origin)
  end
end
The inputs given to the functions are the array for minor ticks (having XTick or YTick objects), the origin, the array for major ticks (having XTick or YTick objects) and finally the number of major ticks to be drawn.
The functions first check if the axes_map hash (initialized in the initialize function of the magick wrapper i.e. the backend) is empty (i.e., if the key for the current axes object stored in active_axes is not present) and if it is then a new key, value pair is created otherwise the value is added. The value for a key i.e. a subplot (axes) object is an array which stores the axes to which this value belongs, the origin of X-axis and Y-axis.
Note that there is only one value array for both X-axis and Y-axis for axes object i.e. a subplot.
So, the origins are stored in a hash and after that, in the draw function for both the axes, this command is called:
@texts.each(&:draw)
This command calls the draw function for each of the Text objects present in texts array. The draw function of the Text object is:
def draw
  Rubyplot.backend.draw_text(
    @text,
    color: @color,
    font: @font,
    size: @size,
    abs_x: @abs_x,
    abs_y: @abs_y,
    rotation: @rotation,
    halign: @halign,
    valign: @valign
  )
end
This function calls the draw_text of the backend and passes all the useful variables, the draw_text is:
def draw_text(text,color: :default,font: nil,size:,
        font_weight: Magick::NormalWeight, halign:, valign:,
        abs_x:,abs_y:,rotation: nil, stroke: 'transparent', abs: true)
  unless text.empty?
    within_window(abs) do
      x = transform_x(x: abs_x, abs: abs)
      y = transform_y(y: abs_y, abs: abs)

      @text.fill = Rubyplot::Color::COLOR_INDEX[color]
      @text.font = font.to_s if font
      @text.pointsize = size
      @text.font_weight = font_weight
      # @text.gravity = GRAVITY_MEASURE[gravity] || Magick::ForgetGravity
      @text.stroke stroke
      @text.stroke_antialias false
      @text.text_antialias = false
      modify_draw(@text, x_shift: x.to_i, y_shift: y.to_i, rotation: rotation) do |draw|
        draw.text(0,0, text.gsub('%', '%%'))
      end
    end
  end
end
Apart from the self-explanatory, the other variables are font_weight which represents Magick’s weight properties(currently not used), halign and valign whcih represent horizontal and vertical alignments respectively, rotation if the text is to be rotated and the stroke which defines the pattern for the text (does not make a difference currently) and the absolute flag as abs.
This function first checks whether the text argument is given or not and only proceeds if it is given. Next, the within_window function is called which sets up the area (the window) in which the drawing is to be done. This function takes a block as input which is just a collection of lines of code to be executed. The function is:
def within_window(abs=false, &block)
  if abs
    # Coordinates are given in rubyplot cordinates
    # Transform function handles deciding the position
    # in the figure
    yield
  else
    # Coordinates are not in rubyplot coordinates
    # Shifting to adjust incorporate the margin of the figure and axes
    # border! method can be used for figure margin but that will disturb rubyplot coordinates
    # i.e. rubyplot coordinates include the border spacing
    x_shift = (@active_axes.abs_x + @active_axes.left_margin) * @canvas_width / @figure.max_x # in pixels
    y_shift = (@active_axes.abs_y - @figure.bottom_spacing + @figure.top_spacing + @active_axes.top_margin) * @canvas_height / @figure.max_y # in pixels
    @draw.translate(x_shift, y_shift)
    @text.translate(x_shift, y_shift)
    @axes.translate(x_shift, y_shift)

    plottable_width = @active_axes.width - (@active_axes.left_margin + @active_axes.right_margin)
    plottable_height = @active_axes.height - (@active_axes.bottom_margin + @active_axes.top_margin)
    # Scaling
    @draw.scale(plottable_width / @figure.max_x, plottable_height / @figure.max_y)
    @text.scale(plottable_width / @figure.max_x, plottable_height / @figure.max_y)
    @axes.scale(plottable_width / @figure.max_x, plottable_height / @figure.max_y)

    # Calling the block
    yield

    # Rescaling
    @draw.scale(@figure.max_x / plottable_width, @figure.max_y / plottable_height)
    @text.scale(@figure.max_x / plottable_width, @figure.max_y / plottable_height)
    @axes.scale(@figure.max_x / plottable_width, @figure.max_y / plottable_height)

    # Reshifting to the original coordinates
    @draw.translate(-1 * x_shift, -1 * y_shift)
    @text.translate(-1 * x_shift, -1 * y_shift)
    @axes.translate(-1 * x_shift, -1 * y_shift)
  end
end
This function first checks the absolute flag and does nothing if it is true(as the coordinates are absolute and no shifting is required), if the absolute flag is false then the data used for drawing is in plot coordinates i.e. according to the data given by the user for the plot. So, if abs = false then there is a need to incorporate the margins for the figure as well as for the subplot and so the origin (upper left corner in magick) is shifted accordingly using Magick’s translate function which takes input as the amount(in pixels) by which X and Y origin is to be shifted, here we are not actually shifting the canvas but instead just the origin of the three Magick::Draw objects draw, text, *axes which actually draw shapes/text/axes on the canvas.
So, the amount by which the objects are to be shifted is to be given in pixels as Magick only accepts pixels and hence the coordinates present in Rubyplot coordinates are first divided by the maximum Rubyplot coordinate to bring the coordinate in the range [0,1] and then it is multiplied by the canvas_width to finally convert the coordinate into pixel value (remember the canvas_width was already scaled according to the figsize_unit). A similar operation is done for Y coordinate with a change that top_margin is incorporated as the origin for Magick backend is the upper left corner.
After translation, scaling is done using scale function of Magick::Draw object which takes input the factor by which X and Y coordinates are to be scaled. This ensures that the drawing is scaled according to the requirements.
After translation and scaling, the block is executed and the Draw object return to their original state by scaling and translating to the original state in which the Draw objects were present.
After the within_window function, the X and Y coordinates are transformed to convert them into pixel values to be used further using the functions transform_x and transform_y which take the inputs, the coordinate to be transformed and the absolute flag. These functions are:
# Transform X co-ordinate.
def transform_x(x: , abs: false)
  if abs
    (@canvas_width.to_f * x.to_f / @figure.max_x.to_f)
  else
    ((x.to_f - @active_axes.x_range[0].to_f) / (@active_axes.x_range[1].to_f - @active_axes.x_range[0].to_f)) * @canvas_width.to_f
  end
end

# Transform Y co-ordinate
def transform_y(y: , abs: false)
  if abs
    (@canvas_height.to_f * (@figure.max_y.to_f - y.to_f) / @figure.max_y.to_f)
  else
    ((@active_axes.y_range[1].to_f - y.to_f) / (@active_axes.y_range[1].to_f - @active_axes.y_range[0].to_f)) * @canvas_height.to_f
  end
end
In these functions, if the absolute flag is true i.e. the coordinates are in Rubyplot coordinates then similar to within_window function, the coordinates are first brought to the range [0,1] and then multiplied by the canvas dimensions to get the coordinates in pixels. The difference in Y coordinate is that in Magick the origin is the upper left corner but we want to make the origin as lower left corner and so the minimum Rubyplot coordinate actually refers to the highest point in the Figure and so we want to flip the position of points vertically and hence the coordinate is first subtracted from the maximum Rubyplot coordinates so that we get the desired plot.
Next, if the absolute flag is false i.e. the coordinates are not in Rubyplot coordinates and are according to the plot, the coordinate is brought to a range [0,1] by using minimum and maximum values of the data. And notice that similar to abs = true, the Y coordinate is scaled so that the position of points is flipped vertically. The x_range and y_range functions are:
def x_range
  [@x_axis.min_val, @x_axis.max_val]
end

def y_range
  [@y_axis.min_val, @y_axis.max_val]
end
These functions return the maximum and minimum values of X and Y axes across all the plots.
After these functions, the useful properties for text variable is set for drawing. Also, the color variable which stores the symbol for the colour is converted to its RGB value which is stored in the COLOR_INDEX hash present in Color module. Next, the font is set if present, then pointsize function sets the size of the text in points unit. Then after setting the remaining useful properties, the text is to be drawn in the text variable which is a Magick::Draw object. But before that the modify_draw function is called which modifies a Magick::Draw object (or an array of such objects) for a temporary period until the block which is given as the input is executed, it takes in the inputs as the Magick::Draw object (or an array of such objects) which is to be modified, the amount of X and Y shift in pixels and the rotation. The function is:
def modify_draw(draw, x_shift: nil, y_shift: nil, scale_x: nil, scale_y: nil, rotation: nil, &block)
  draw = [draw] unless draw.respond_to? :each # Making draw iterable if not iterable
  draw.each do |d|
    d.translate(x_shift, y_shift) if x_shift && y_shift
    d.rotate(rotation) if rotation
    d.scale(scale_x, scale_y) if scale_x && scale_y
  end

  draw.each do |d|
    yield(d)
  end

  draw.each do |d|
    d.scale(1 / scale_x, 1 / scale_y) if scale_x && scale_y
    d.rotate(90.0) if rotation
    d.translate(-1 * x_shift, -1 * y_shift) if x_shift && y_shift
  end
  draw = draw[0] unless draw.respond_to? :each
end
This function first makes the draw local variable iterable if it is not an array, then for each iten in the array it translates, scales and rotates the Draw object, then it executes the block and then returns the Draw object to its original state.
One important thing to keep in mind is that the Draw object is rotated with respect to its origin.
So, we call the modify_draw function and then use the text of the Magick::Draw object to create a text on the required point. Here, we used the modify_draw function because we wanted to rotate the text correctly. So, first we translated the Magick::Draw object’s origin to where the text is to be drawn then we rotated the object with respect to the point where the text is to be drawn and then we drew the text at the point 0,0 which is actually the point where text is to be drawn as the origin of the Magick::Draw object is the point where the text was to be drawn.
Also, in the string text the ‘%’ is replaced with ‘%%’ using the gsub function so that Ruby does not interpret ‘%’ as a keyword.
So, now the draw function of the X and Y axis has been executed and we return to draw function of the subplot i.e. the axes.
The next command is:
@texts.each(&:draw)
which works in a similar way as described above (in draw of X and Y axes).
Next, the code is:
@legend_box.draw
which calls the draw function for legend_box:
def draw
  unless @legends.empty?
    @bounding_box.draw
    @legends.each(&:draw)
  end
end
This function only proceeds when there is at least one Legend object is present in legends array. If legends array is not empty then first the draw function is called for bounding_box which is actually a Rectangle object whose draw function is:
def draw
  Rubyplot.backend.draw_rectangle(
    x1: @x1,
    y1: @y1,
    x2: @x2,
    y2: @y2,
    border_color: @border_color,
    fill_color: @fill_color,
    abs: @abs
  )
end
which simply calls the draw_rectangle function of the backend and the inputs given to it are the x,y coordinates of the lower left and upper right corners, the colour of the border and the colour to be filled in the rectangle and finally the absolute flag (which is true here).
The draw_rectangle function is:
def draw_rectangle(x1:,y1:,x2:,y2:, border_color: :default,
        fill_color: nil, border_width: 1, border_type: nil, abs: false)
    within_window(abs) do
    x1 = transform_x(x: x1, abs: abs)
    x2 = transform_x(x: x2, abs: abs)
    y1 = transform_y(y: y1, abs: abs)
    y2 = transform_y(y: y2, abs: abs)

    @draw.stroke Rubyplot::Color::COLOR_INDEX[border_color]
    @draw.fill Rubyplot::Color::COLOR_INDEX[fill_color] if fill_color
    @draw.stroke_width border_width.to_f
    # if fill_color is not given, the rectangle fill colour is transparent
    # i.e. only edges are visible
    @draw.fill_opacity 0 unless fill_color
    @draw.rectangle x1, y1, x2, y2
    @draw.fill_opacity 1 unless fill_color
  end
end
Here, first within_window is called which works the same as explained before, then the coordinates are transformed using transform_x and transform_y which work the same as explained before. Then the colour of the border and the colour to be filled are set using the stroke and fill functions of Magick::Draw respectively. The COLOR_INDEX hash is used to provide the colour in the correct format. Then the border width is set using stroke_width function. Then opacity is set to 0 if no colour is to be filled i.e. fill_color is not given i.e. it is nil. Finally, the rectangle function is called which takes in two opposite corners and draws the rectangle. And then the opacity is returned to 1 i.e. its original state.
P.S. - The rectangle is drawn in draw variable and the text was drawn in text variable.
Now, the draw function for each Legend object is called:
def draw
  @legend_color_box.draw
  @text.draw
end
In this function, the legend_color_box and text call their draw function which is actually Rectangle and Text objects. We have already discussed the explanation for drawing these objects.
Drawing plots
Returning to the draw function of the axes, the final line of code is:
@plots.each(&:draw)
The draw function for each plot in plots array is called. In this example we have only one plot which is the scatter plot i.e. a Scatter object and hence the draw function of Scatter is called:
def draw
  Rubyplot.backend.draw_markers(
    x: @data[:x_values],
    y: @data[:y_values],
    type: @marker_type,
    fill_color: @marker_fill_color,
    border_color: @marker_border_color,
    size: [@marker_size] * @data[:x_values].size
  )
end
which simply calls the backend function draw_markers and the inputs given to it are the arrays containing the X and the Y data, the type of marker to be drawn, the colour to be filled in the marker and the border and finally an array of sizes of the markers(the size for all the markers is kept same). The draw_markers function is:
def draw_markers(x:, y:, type: nil, fill_color: :default, border_color: :default, size: nil)
  y.each_with_index do |iy, idx_y|
    ix = transform_x(x: x[idx_y],abs: false)
    iy = transform_y(y: iy, abs: false)
    # in GR backend size is multiplied by
    # nominal size generated on the graphics device
    # so setting the nominal_factor
    nominal_factor = 15
    within_window do
      size[idx_y] *= nominal_factor
      MARKER_TYPES[type].call(@draw, ix, iy, fill_color, border_color, size[idx_y])
    end
  end
end
In this function for each entry in the data (same for X or Y) a marker is drawn, so a loop is executed in which for each entry first the X and Y coordinates are transformed using transform_x and transform_y functions (explained earlier). Then the size is multiplied by a nominal_factor to make the backends consistent. In GR backend, the size is multiplied by the nominal size generated on the graphics device(the value is not disclosed) and so for Magick backend nominal_factor is chosen as 15 (found through trial and error by comparing the same figures for both backends). Now, the within_window function is called (explained earlier) and size is multiplied by the nominal_factor. Then the marker is drawn in the draw object using the MARKER_TYPES which stores lambdas for drawing the markers and so according to the type the lambda stored in MARKER_TYPES is called using call. Each of the Lambda takes in input the Magick::Draw object, the x,y coordinates (in pixels), the colour to be filled, the border colour and the size of the marker.
In this example, the types of the marker is :circle and the Lambda for it is:
MARKER_TYPES = {
  # Default type is circle
  # Stroke width is set to 1
  nil: ->(draw, x, y, fill_color, border_color, size) {
    draw.stroke Rubyplot::Color::COLOR_INDEX[border_color]
    draw.fill Rubyplot::Color::COLOR_INDEX[fill_color]
    draw.circle(x,y, x + size,y)
  },
  circle: ->(draw, x, y, fill_color, border_color, size) {
    draw.stroke Rubyplot::Color::COLOR_INDEX[border_color]
    draw.fill Rubyplot::Color::COLOR_INDEX[fill_color]
    draw.circle(x,y, x + size,y)
  },
  # Code for rest of the markers is not shown because of space constraints
}
The :circle Lambda first sets the colour of the border and the colour to be filled and then it calls the circle function for the Magick::Draw object stored in draw local variable to draw a circle. The function takes in inputs as the x,y coordinates for the centre and a point at the circumference (in pixel values). So, the marker is drawn in the draw variable.
We now return to the write function of the Figure.
Writing Figure (Backend)
Now, the write function of the backend is called:
def write
  draw_axes
  @draw.draw(@base_image)
  @text.draw(@base_image)
  @base_image.write(@file_name)
end
This function first calls the draw_axes which will draw the axes Magick::Draw object onto the Magick::Image object base_image which is the canvas. Then the draw function is called for the Magick::Draw objects draw and text and the input is given is base_image, so the Magick::Draw objects are drawn onto the canvas i.e. Magick::Image object. And finally, the write function is called for base_image which is a Magick::Image, the function takes the input a string which would be the name of the file(image) when saved and so the base_image is written onto the device.
The draw_axes function is:
def draw_axes
  @axes_map.each_value do |v|
    axes = v[:axes]
    @active_axes = axes
    within_window do
      # Plot the X and Y axes
      @axes.polyline(
        transform_x(x: v[:x_origin]),transform_y(y: v[:y_origin]), transform_x(x: axes.x_range[1]),transform_y(y: v[:y_origin]),
        transform_x(x: v[:x_origin]),transform_y(y: v[:y_origin]), transform_x(x: v[:x_origin]),transform_y(y: axes.y_range[1])
      )
    end
  end
  @axes.draw(@base_image)
end
This function is used to draw the X and Y axis using the axes_map hash. Now, for every key in the axes_map hash first the axes variable is set as the subplot(axes) for which the X and Y axes is to be drawn, then the active_axes is set as the subplot. Then the within_window function is called (explained earlier) and then the polyline function is called for axes magick::Draw object which draws multiple line by taking the inputs as multiple x,y coordinate pairs for starting and ending points of the lines (in pixels). So, the inputs given to draw the X axis are the transformed points origin of the axes and the maximum value of X, Y origin. For the Y axis, the inputs given are the transformed points origin of the axes and the X origin, maximum value of Y.
Finally, the axes Magick::Draw object is drawn using the draw function on the base_image Magick::image object (canvas).
We now return to the write function of the Figure to execute the last line of code. Notice that we have already drawn and saved the figure.
Finishing up
Finally the backend’s stop_output_device function is called:
def stop_output_device
  @canvas_width, @canvas_height = unscale_figure(@canvas_width, @canvas_height)
  flush
end
This function first scales the canvas dimensions to its original values by calling unscale_figure which were scaled according to the figsize_units variable. Then the flush function is called which clears the memory by disposing of data which is no longer useful.
The unscale_figure function is:
def unscale_figure(width, height)
  [width / PIXEL_MULTIPLIERS[@figure.figsize_unit], height / PIXEL_MULTIPLIERS[@figure.figsize_unit]]
end
The width and the height are divided by the conversion constants set in the PIXEL_MULTIPLIERS hash (explained earlier). So, the Figure dimensions are scaled back to its original values.
The flush function is:
# Refresh this backend and remove all previously set data.
def flush
  @axes_map = {}
  @file_name = nil
end
First the axes_map is cleared and then the file_name is cleared. This refreshes the backend and clears the memory.
So, we have finally drawn, written and saved our figure.
Enjoy Reading This Article?
Here are some more articles you might like to read next: